 English
  Русский
 Bahasa Indonesia
 Bahasa Malay
 ไทย
ไทย Español
 Deutsch
 Български
 Français
 Tiếng Việt
 中文
中文 বাংলা
বাংলা हिन्दी
 Čeština
 Українська
 Română

GBP/USD is consolidating gains across the board and above the 200 SMA at H1 chart is expected to post fresh highs. However, the resistance level of 1.4280 seems to be a tough nut to crack and if it manages to break above it, the next target would be the 1.4393 level. To the downside, if the support zone of 1.4060 gives up, then it can plummet below the 1.40 mark once again.
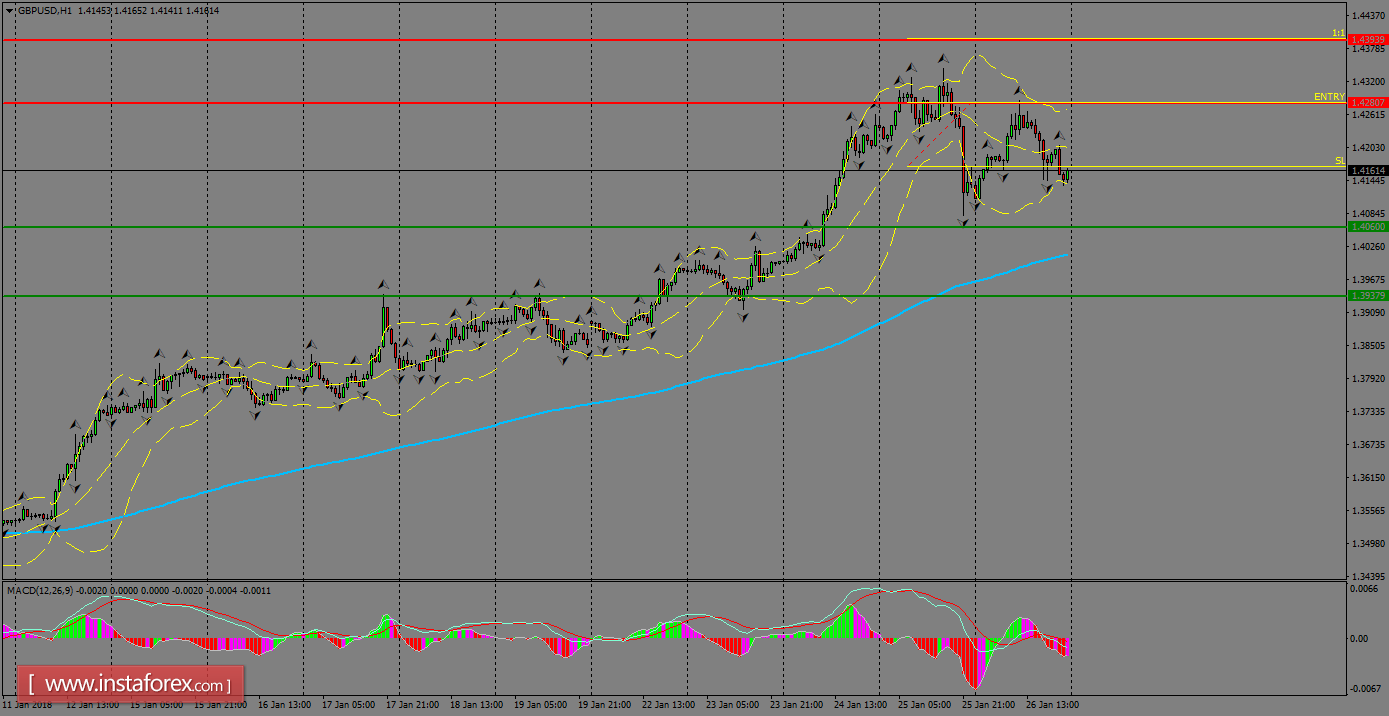
H1 chart's resistance levels: 1.4280 / 1.4393
H1 chart's support levels: 1.4060 / 1.3937
Trading recommendations for today: Based on the H1 chart, buy (long) orders only if the GBP/USD pair breaks a bullish candlestick; the resistance level is at 1.4280, take profit is at 1.4393 and stop loss is at 1.4168.