 English
  Русский
 Bahasa Indonesia
 Bahasa Malay
 ไทย
ไทย Español
 Deutsch
 Български
 Français
 Tiếng Việt
 中文
中文 বাংলা
বাংলা हिन्दी
 Čeština
 Українська
 Română

The index continues to trade below the 200 SMA, and it seems we could expect a leg lower towards the support zone of 87.88. However, as USDX didn't post a new low below the January 25th lows, we could expect a recovery that would take the index to test the 200 SMA at H1 chart. MACD indicator remains in a flat tone.
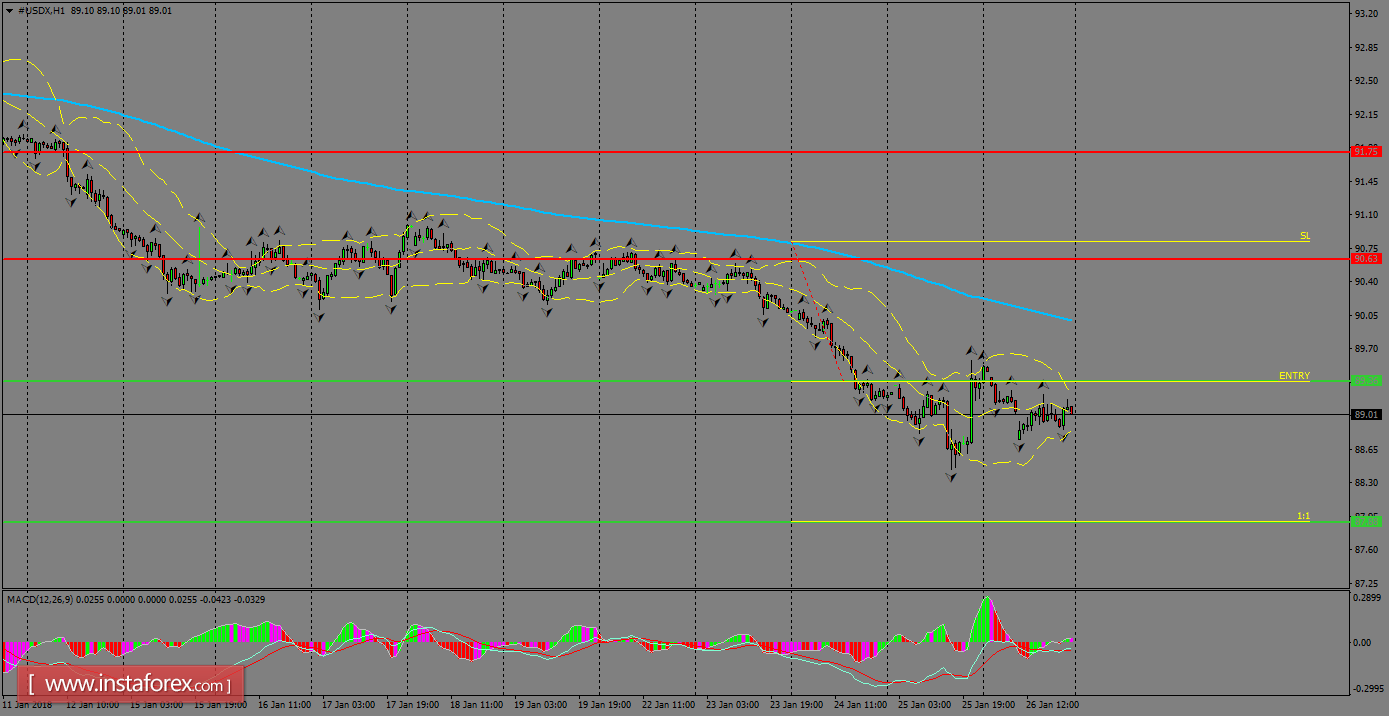
H1 chart's resistance levels: 90.63 / 91.75
H1 chart's support levels: 89.36 / 87.88
Trading recommendations for today: Based on the H1 chart, place sell (short) orders only if the USD Index breaks with a bearish candlestick; the support level is at 89.36, take profit is at 87.88 and stop loss is at 90.81.