 English
  Русский
 Bahasa Indonesia
 Bahasa Malay
 ไทย
ไทย Español
 Deutsch
 Български
 Français
 Tiếng Việt
 中文
中文 বাংলা
বাংলা हिन्दी
 Čeština
 Українська
 Română

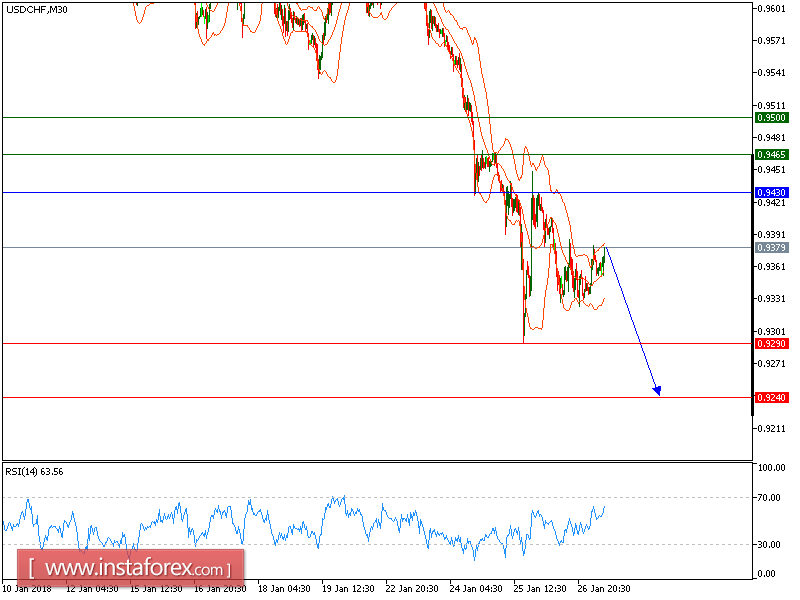
USD/CHF is under pressure. The pair is trading on the downside, capped by its falling 50-period moving average. The nearest key resistance at 0.9430 maintains the strong selling pressure on the prices. Last but not least, the process of lower highs and lows remains intact, which should confirm a negative outlook.
Therefore, as long as 0.9430 is a resistance, look for choppy price action with a bearish bias. Our next down targets are set at 0.9290 and 0.9240.
Chart Explanation: The black line shows the pivot point. The present price above the pivot point indicates a bullish position, and the price below the pivot point indicates a short position. The red lines show the support levels, and the green line indicates the resistance levels. These levels can be used to enter and exit trades.
Strategy: SELL, stop loss at 0.9465, take profit at 0.9285.
Resistance levels: 0.9465, 0.9500, and 0.9540
Support levels: 0.9290, 0.9240, and 0.9200.