 English
  Русский
 Bahasa Indonesia
 Bahasa Malay
 ไทย
ไทย Español
 Deutsch
 Български
 Français
 Tiếng Việt
 中文
中文 বাংলা
বাংলা हिन्दी
 Čeština
 Українська
 Română

The pair is making a retracement from the resistance level of 1.4280 and it's trying to post another low in order to reach the 200 SMA at the H1 chart. Such indicator can provide a dynamic support to the Cable and if that happens, the resistance zone of 1.4280 could give up in order to allow more gains toward the 1.4393 level. MACD indicator remains in the negative territory, favoring to the bears.
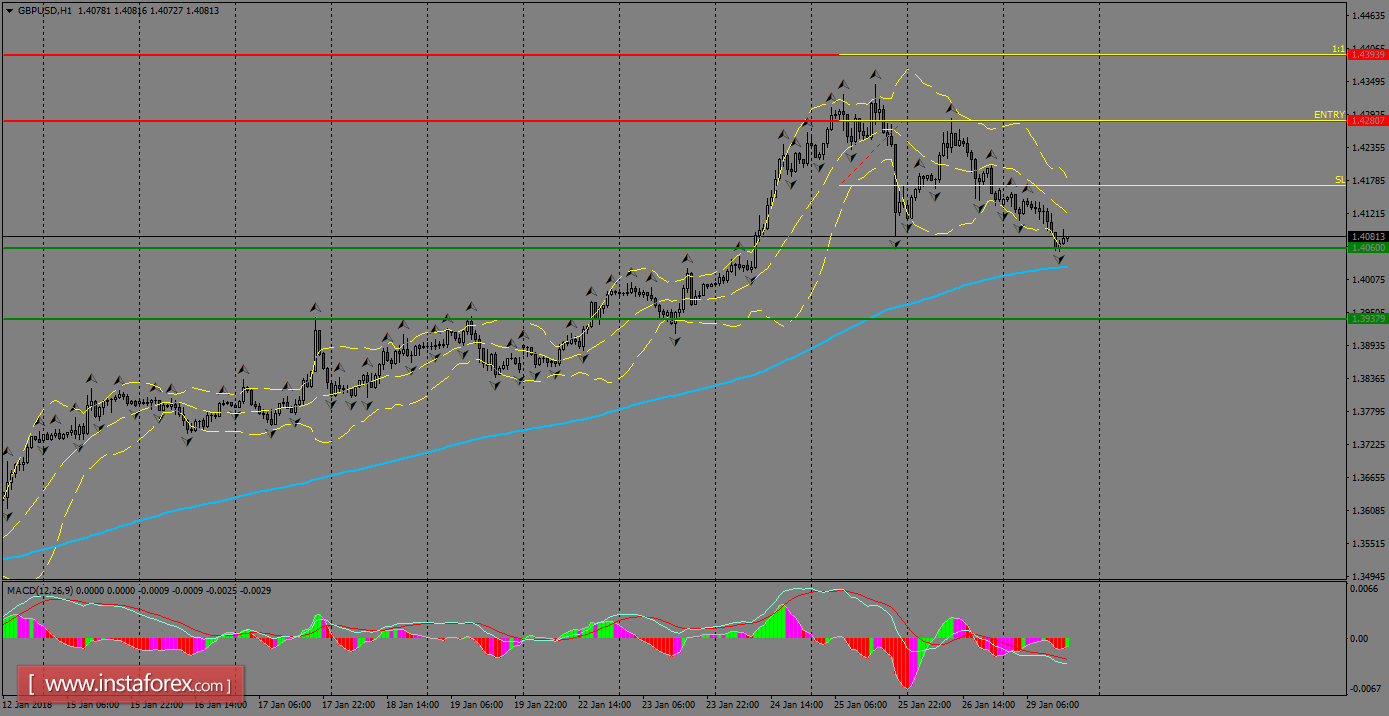
H1 chart's resistance levels: 1.4280 / 1.4393
H1 chart's support levels: 1.4060 / 1.3937
Trading recommendations for today: Based on the H1 chart, buy (long) orders only if the GBP/USD pair breaks a bullish candlestick; the resistance level is at 1.4280, take profit is at 1.4393 and stop loss is at 1.4168.