 English
  Русский
 Bahasa Indonesia
 Bahasa Malay
 ไทย
ไทย Español
 Deutsch
 Български
 Français
 Tiếng Việt
 中文
中文 বাংলা
বাংলা हिन्दी
 Čeština
 Українська
 Română

GBP/USD managed to recover from the 200 SMA at the H1 chart and it seems we could expect a rally towards the resistance zone of 1.4280. Such move could strengthen the bullish path for the short-term and if the pair does a break above that barrier, the next target would be the 1.4393 level. MACD indicator remains in favor of the bulls.
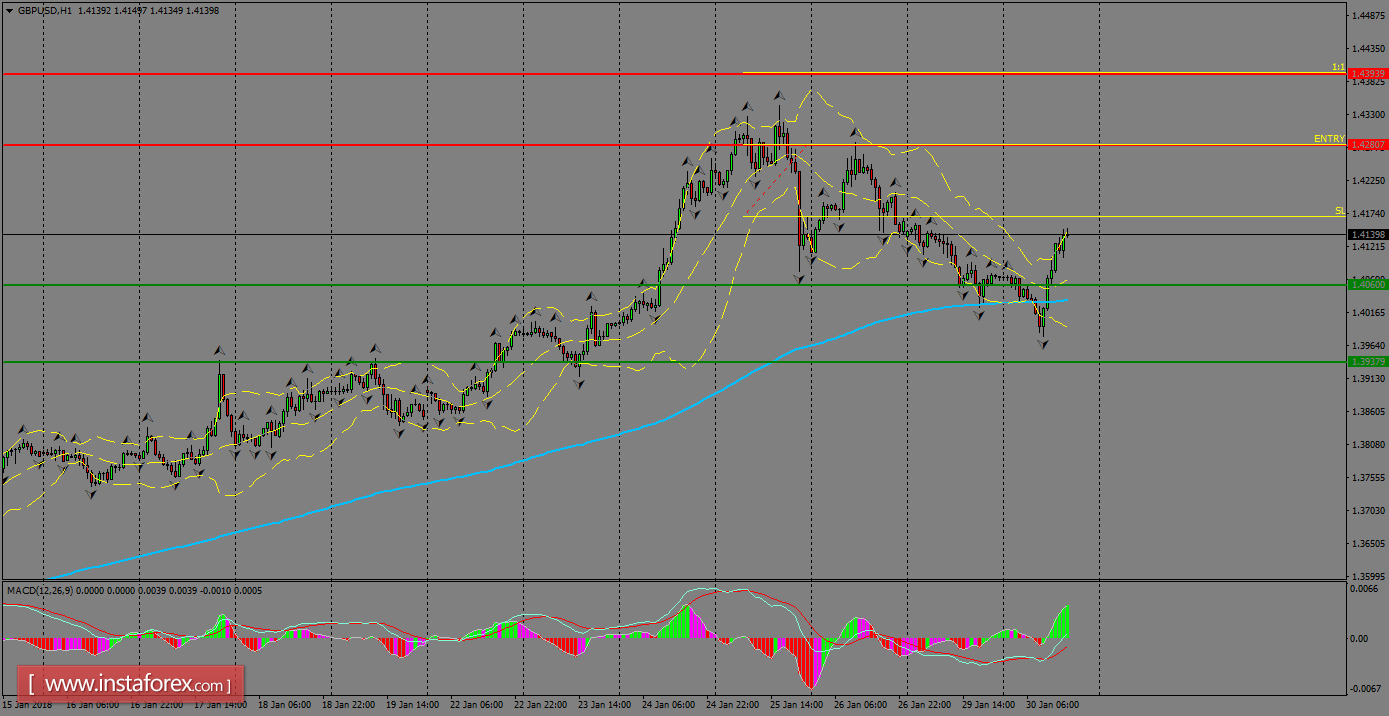
H1 chart's resistance levels: 1.4280 / 1.4393
H1 chart's support levels: 1.4060 / 1.3937
Trading recommendations for today: Based on the H1 chart, buy (long) orders only if the GBP/USD pair breaks a bullish candlestick; the resistance level is at 1.4280, take profit is at 1.4393 and stop loss is at 1.4168.