 English
  Русский
 Bahasa Indonesia
 Bahasa Malay
 ไทย
ไทย Español
 Deutsch
 Български
 Français
 Tiếng Việt
 中文
中文 বাংলা
বাংলা हिन्दी
 Čeština
 Українська
 Română

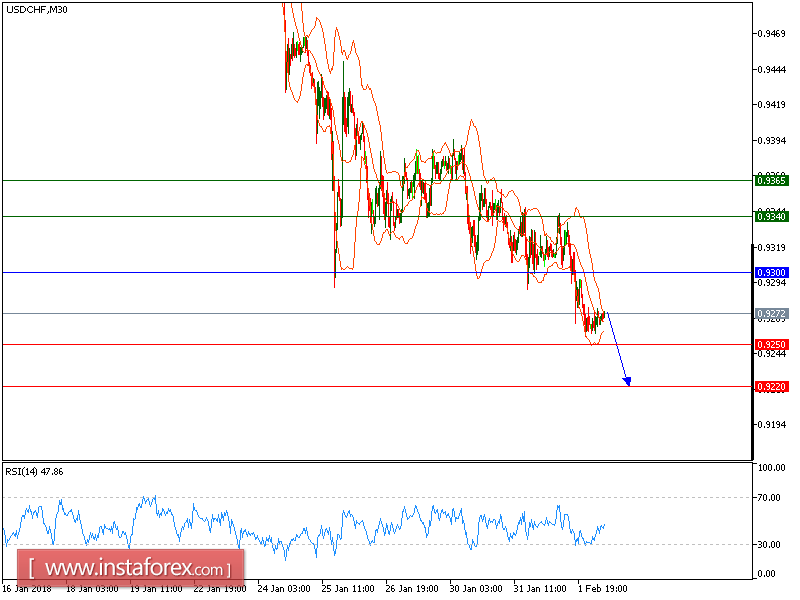
USD/CHF is expected to move toward 0.9220. The pair remains under pressure below its key resistance at 0.9300, and is now testing its support at 0.9250. Both the 20-period and 50-period moving averages are heading downward, and should maintain the strong selling pressure on the prices. Last but not least, the relative strength index is bearish below its neutrality area at 50.
In which case, as long as 0.9300 is not surpassed, it is likely to decline to 0.9250 and 0.9220 in extension.
Chart Explanation: The black line shows the pivot point. The present price above the pivot point indicates a bullish position, and the price below the pivot point indicates a short position. The red lines show the support levels, and the green line indicates the resistance levels. These levels can be used to enter and exit trades.
Strategy: SELL, stop loss at 0.9300, take profit at 0.9250.
Resistance levels: 0.9340, 0.9365, and 0.93700
Support levels: 0.9250, 0.9220, and 0.9200.