 English
  Русский
 Bahasa Indonesia
 Bahasa Malay
 ไทย
ไทย Español
 Deutsch
 Български
 Français
 Tiếng Việt
 中文
中文 বাংলা
বাংলা हिन्दी
 Čeština
 Українська
 Română

GBP/USD made another leg lower and is consolidating losses below the resistance zone of 1.3937. However, we might expect a resume of the bullish bias in the nearest term and if that happens, the 200 SMA at the H1 chart could be challenged. If it manages to break below 1.3850, doors will open for a decline to test the 1.3800 handle.
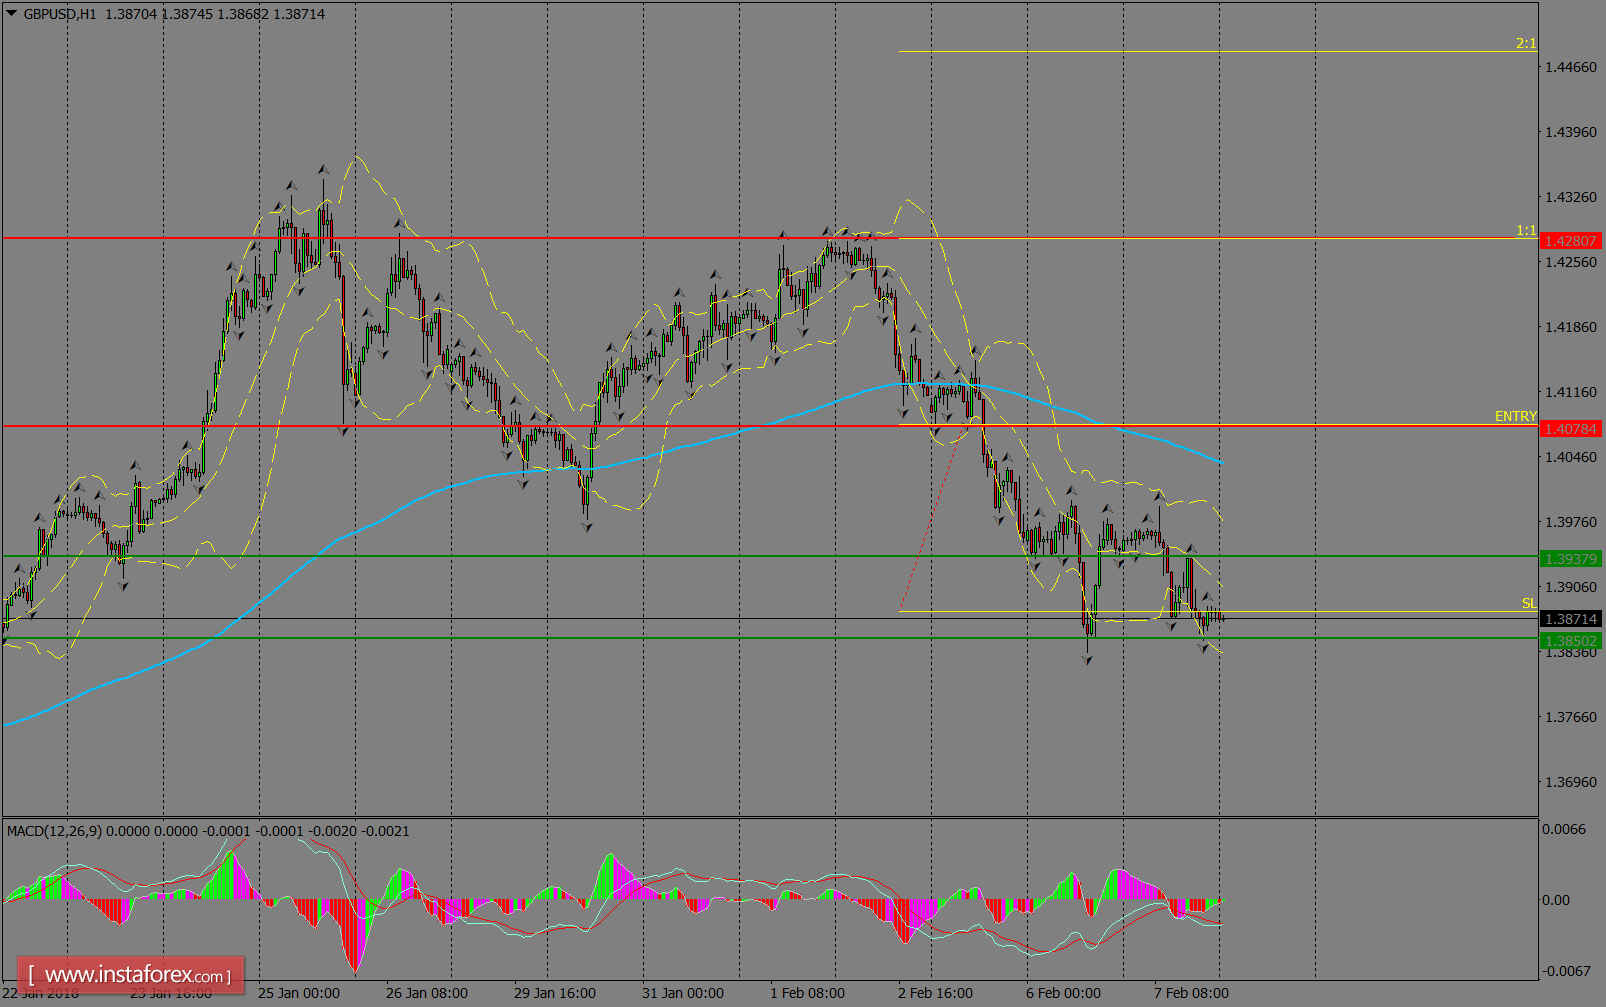
H1 chart's resistance levels: 1.4078 / 1.4280
H1 chart's support levels: 1.3937 / 1.3850
Trading recommendations for today: Based on the H1 chart, buy (long) orders only if the GBP/USD pair breaks a bullish candlestick; the resistance level is at 1.4078, take profit is at 1.4280 and stop loss is at 1.3878.