 English
  Русский
 Bahasa Indonesia
 Bahasa Malay
 ไทย
ไทย Español
 Deutsch
 Български
 Français
 Tiếng Việt
 中文
中文 বাংলা
বাংলা हिन्दी
 Čeština
 Українська
 Română

The pair had a volatile journey during Thursday and it found dynamic resistance in the 200 SMA at H1 chart. The support zone of 1.3850 still holds across the board and we can expect it remains solid as the Cable scopes to test the resistance zone of 1.4078. The MACD indicator is supporting the bearish scenario as of writing because it's in the negative territory.
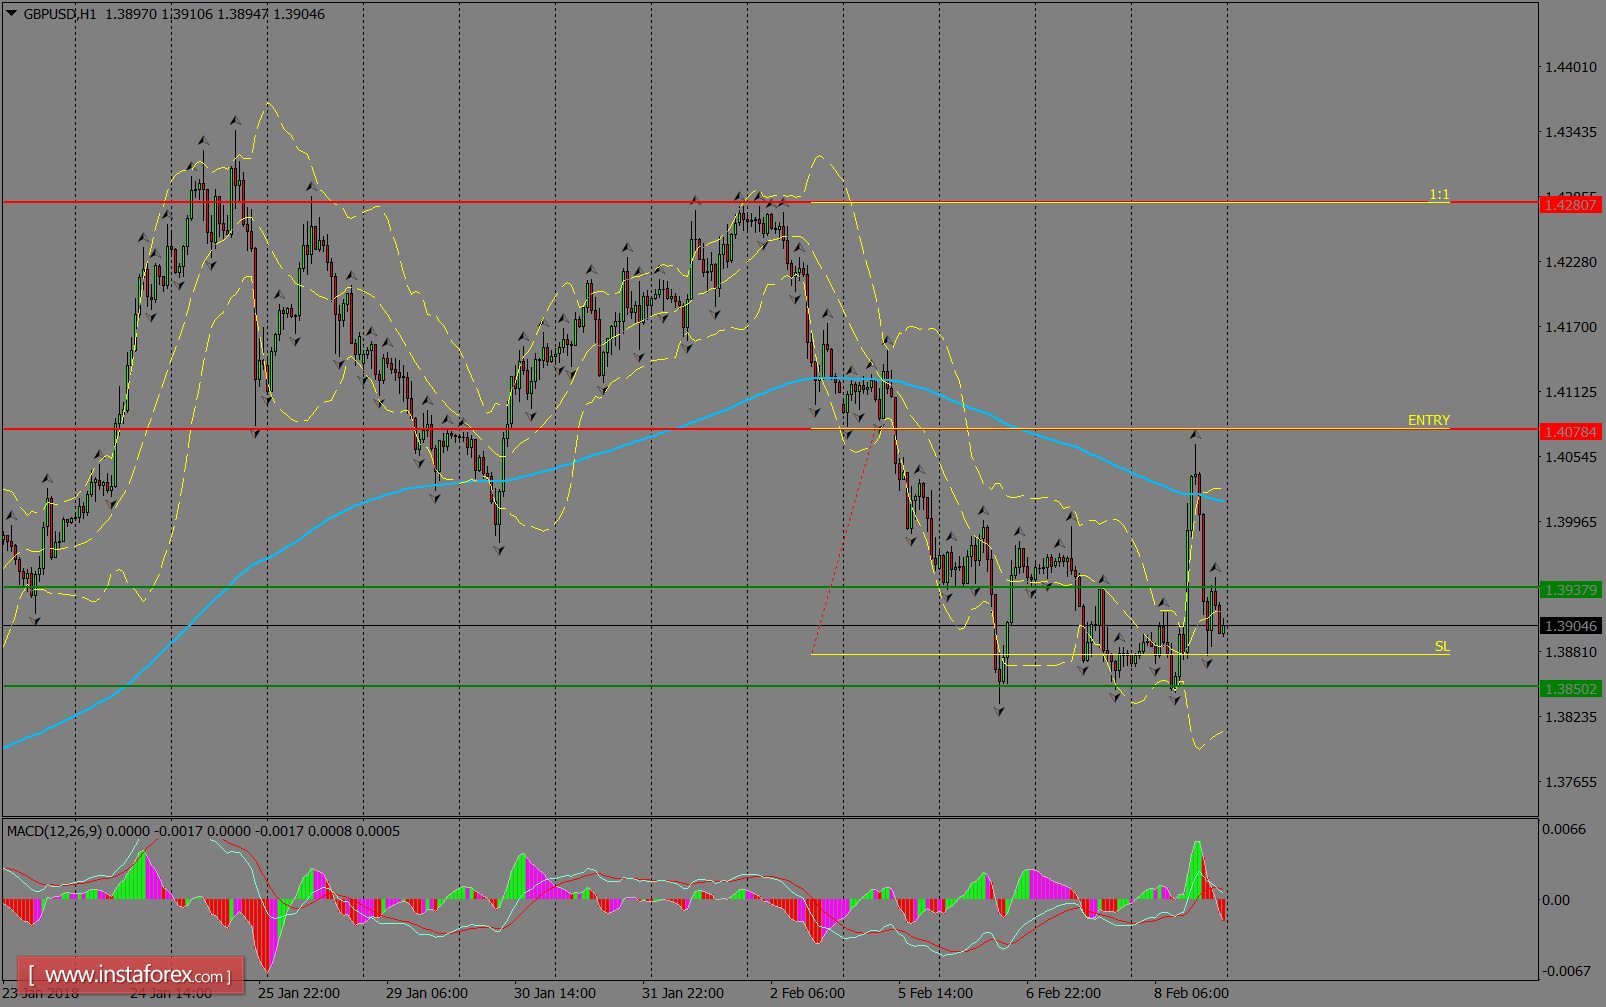
H1 chart's resistance levels: 1.4078 / 1.4280
H1 chart's support levels: 1.3937 / 1.3850
Trading recommendations for today: Based on the H1 chart, buy (long) orders only if the GBP/USD pair breaks a bullish candlestick; the resistance level is at 1.4078, take profit is at 1.4280 and stop loss is at 1.3878.