 English
  Русский
 Bahasa Indonesia
 Bahasa Malay
 ไทย
ไทย Español
 Deutsch
 Български
 Français
 Tiếng Việt
 中文
中文 বাংলা
বাংলা हिन्दी
 Čeština
 Українська
 Română

USDX stayed in a recovery phase on Thursday and gains are being capped by the resistance level of 90.63. If a breakout happens over there, the index could travel towards the 91.75 zone. As long as it remains above the 200 SMA at the H1 chart, we expect further bullish moves. However, the risk to the downside is still high and one could expect a leg lower to test the 89.36 level.
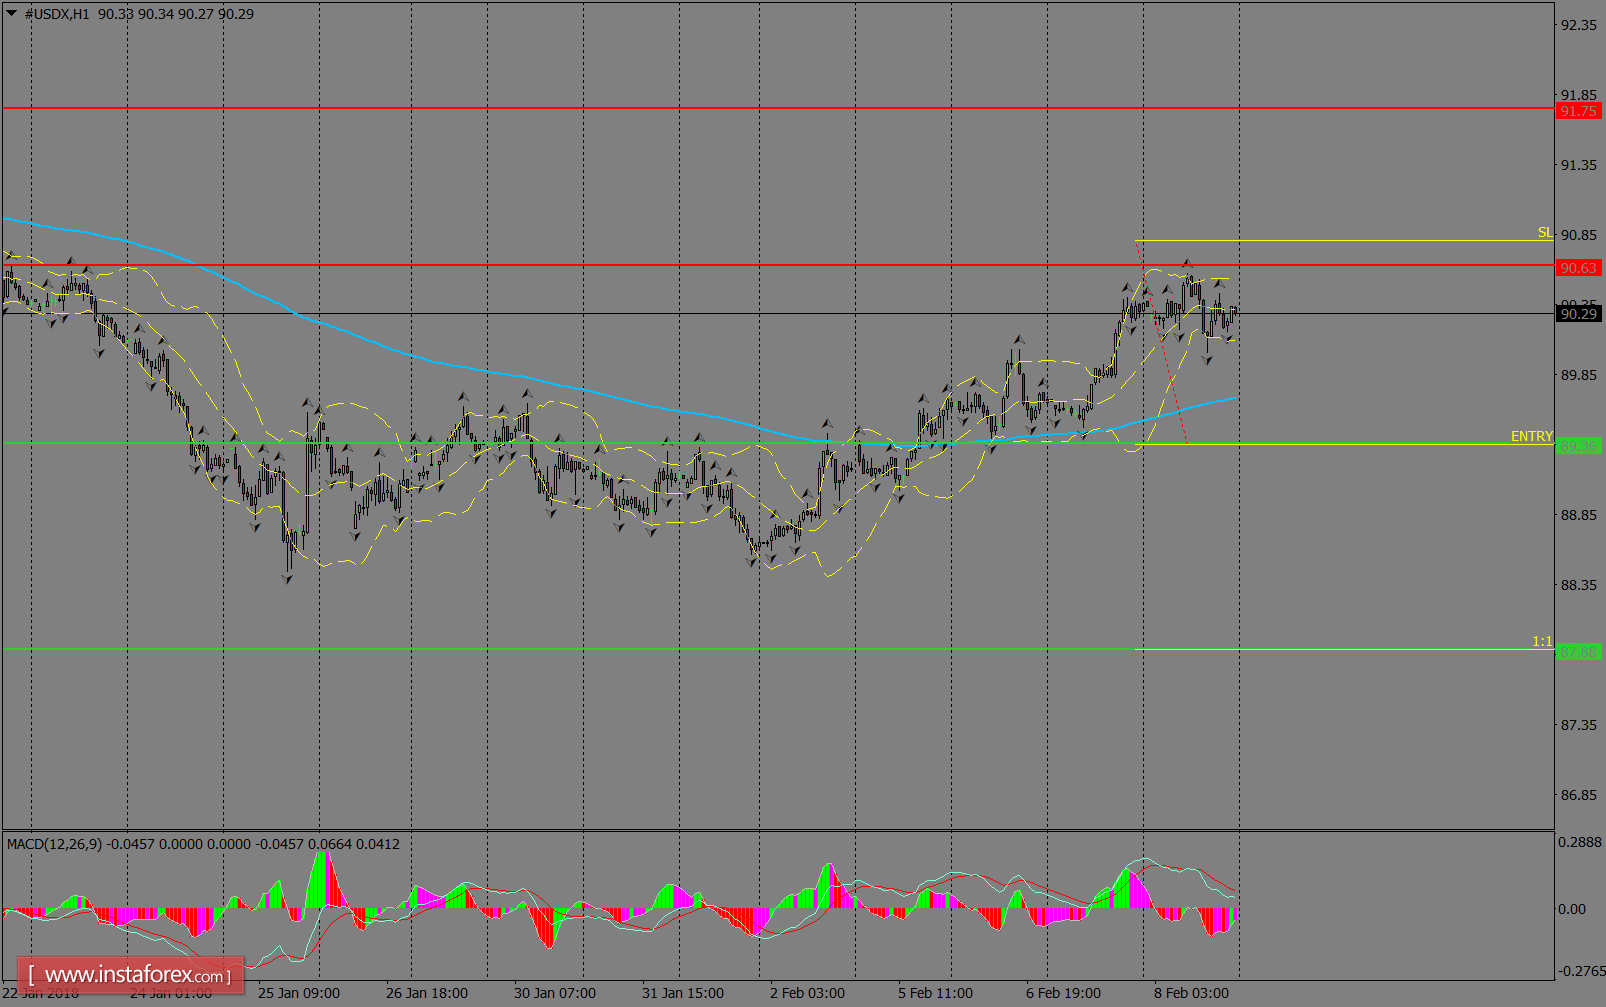
H1 chart's resistance levels: 90.63 / 91.75
H1 chart's support levels: 89.36 / 87.88
Trading recommendations for today: Based on the H1 chart, place sell (short) orders only if the USD Index breaks with a bearish candlestick; the support level is at 89.36, take profit is at 87.88 and stop loss is at 90.81.