The Dollar index has stopped its ascension at the kijun-sen resistance. Bulls need to be very cautious because this is also the 38% Fibonacci retracement of the decline from 94.25. We might see one more new lower low towards 87 in the Dollar index before a bigger bounce. This scenario will be confirmed on a break below 89.60.

The Dollar index has broken out of the Ichimoku cloud and is trading above it. This is good news for bulls. We could see a pull back to back test the broken cloud. This back test could pull back price towards 89.60-89.30 which is now support. Bulls must defend this level if prices turn lower.
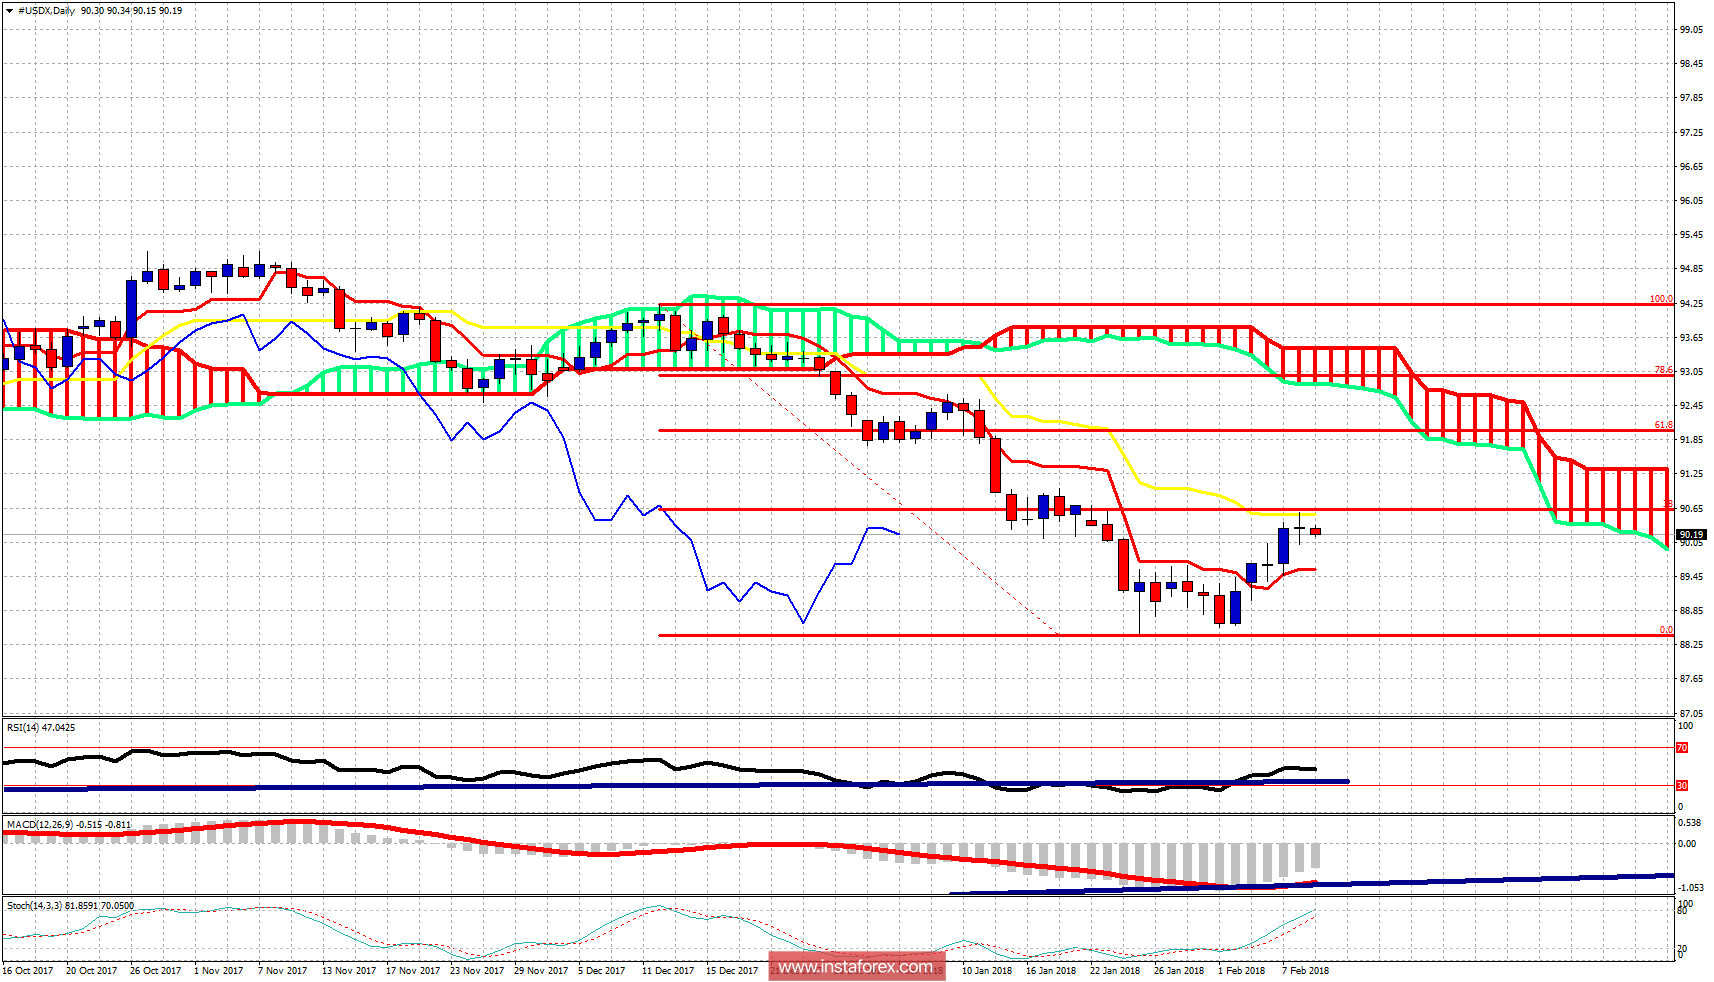
On a daily basis the Dollar index has stopped its rise at the kijun-sen (yellow line indicator) and at the same time the 38% Fibonacci retracement. This confirms the importance of the resistance level at 90.60. Support is at the tenkan-sen (Red line indicator). Breaking below it will be a bad sign for bulls. Bulls need to break above 90.60 in order to have hopes for a bigger bounce in the index.
*The market analysis posted here is meant to increase your awareness, but not to give instructions to make a trade
 English
  Русский
 Bahasa Indonesia
 Bahasa Malay
 ไทย
ไทย Español
 Deutsch
 Български
 Français
 Tiếng Việt
 中文
中文 বাংলা
বাংলা हिन्दी
 Čeština
 Українська
 Română
