 English
  Русский
 Bahasa Indonesia
 Bahasa Malay
 ไทย
ไทย Español
 Deutsch
 Български
 Français
 Tiếng Việt
 中文
中文 বাংলা
বাংলা हिन्दी
 Čeština
 Українська
 Română

Overview:
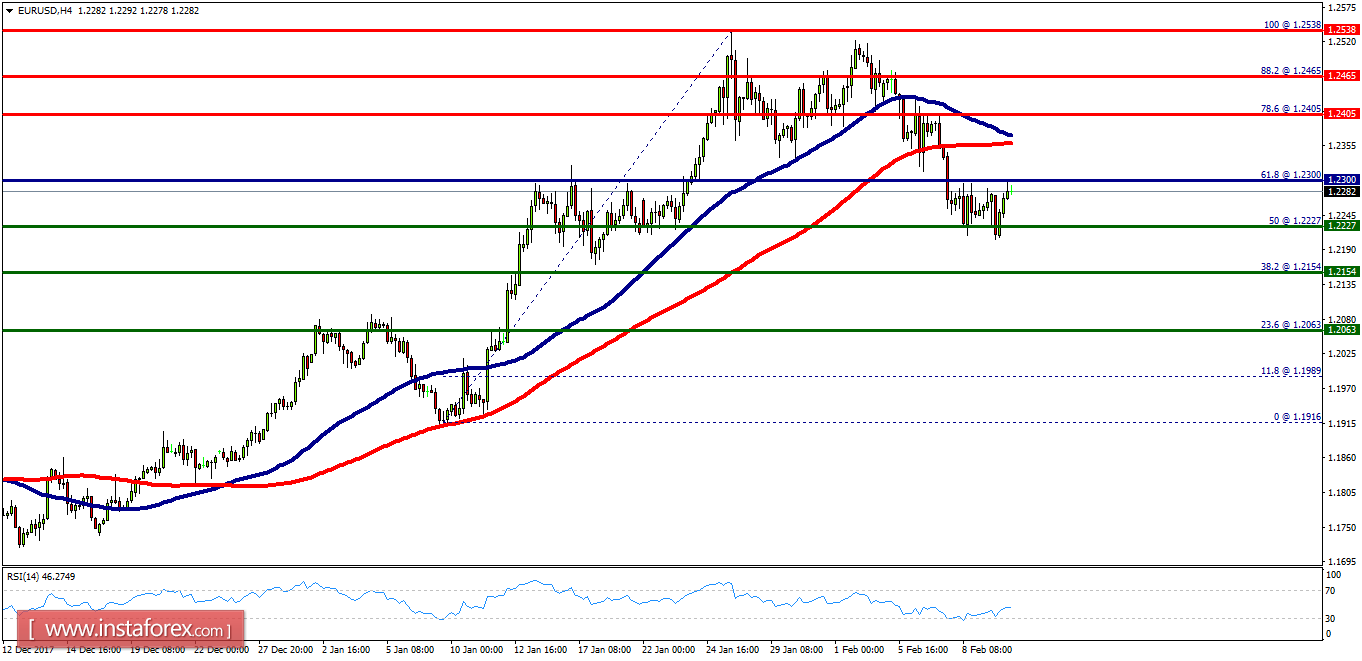
- The EUR/USD pair has broken resistance at the level of 1.2227, which acts as support now. So, the pair has already formed minor support at 1.2227. The strong support is seen at the level of 1.2063 because it represents the weekly support 3. On the H4 chart, the RSI and the moving average (100) are still pointing to the upside. Therefore, the market indicates a bullish opportunity at the level of 1.2227. Buy above the minor support of 1.2227 with a target at 1.2405 (this price is coinciding with the ratio of 78.6% Fibonacci). Later, the EUR/USD pair may resume its movement to 1.2538 to test the double top. On the other hand, if the pair closes below the minor support (1.2227), the price will fall into the bearish market in order to go further towards the strong support at 1.2063.
Comment:
- Also, the double bottom is seen at the level of 1.1916.
- If the trend is buoyant, then the currency pair strength will be defined as following: EUR is in an uptrend, and USD is in a downtrend.