 English
  Русский
 Bahasa Indonesia
 Bahasa Malay
 ไทย
ไทย Español
 Deutsch
 Български
 Français
 Tiếng Việt
 中文
中文 বাংলা
বাংলা हिन्दी
 Čeština
 Українська
 Română

The Dollar index is pulling back as expected towards the cloud support and previous resistance of 89.60. Price remains above the cloud support in the 4-hour chart, so the short-term trend remains bullish.
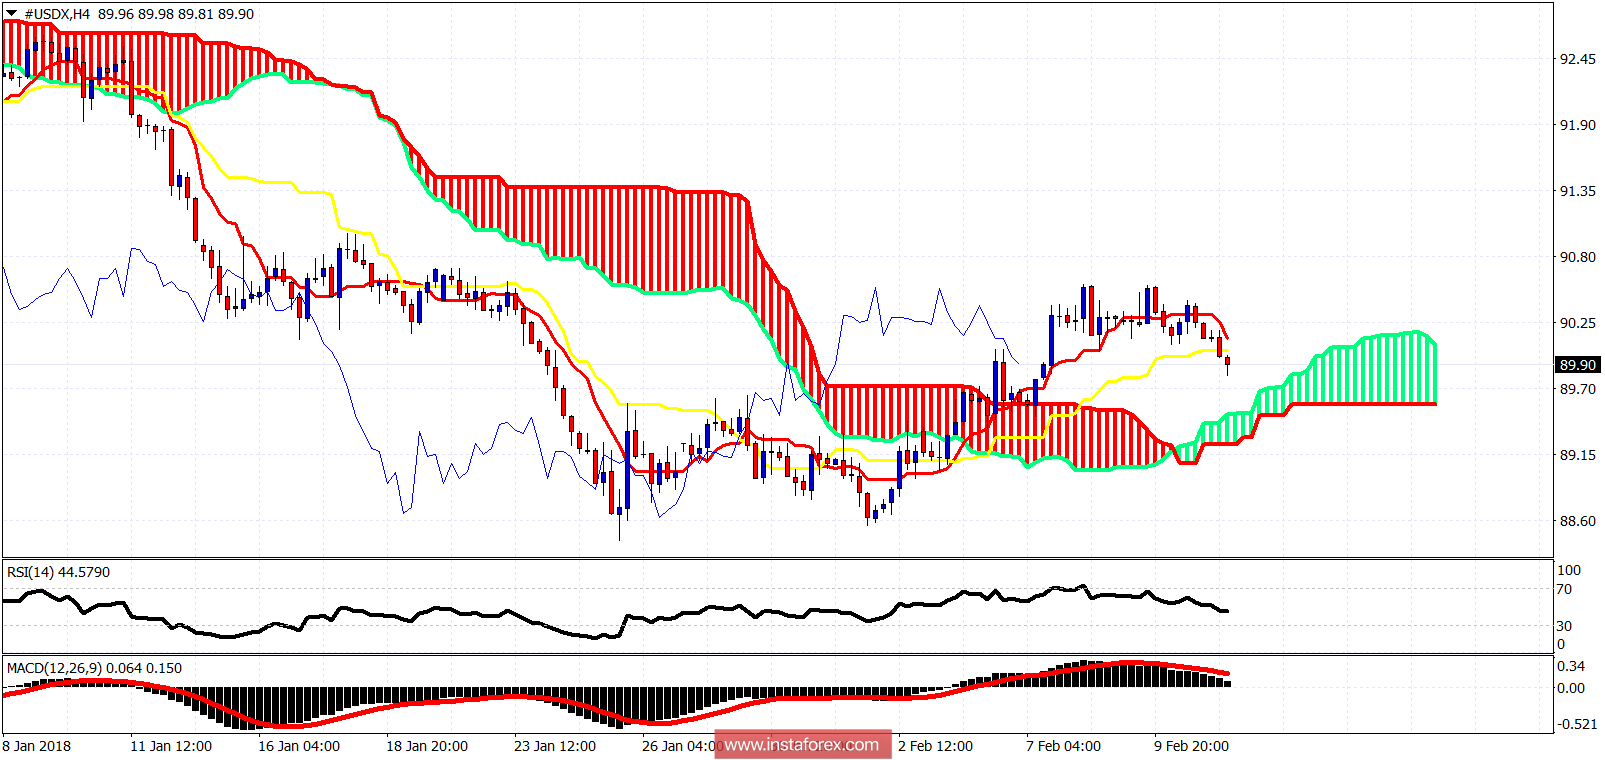
Short-term support is at 89.60. Resistance is at 90.56. Price has broken below the kijun-sen and is heading towards cloud support. Bulls need to bounce from the support levels and eventually break above 90.56. Making a higher low is important for bulls. If price however breaks through and below the 4-hour cloud, this will imply that the entire bounce is most probably over and we are heading for new lows towards 87.
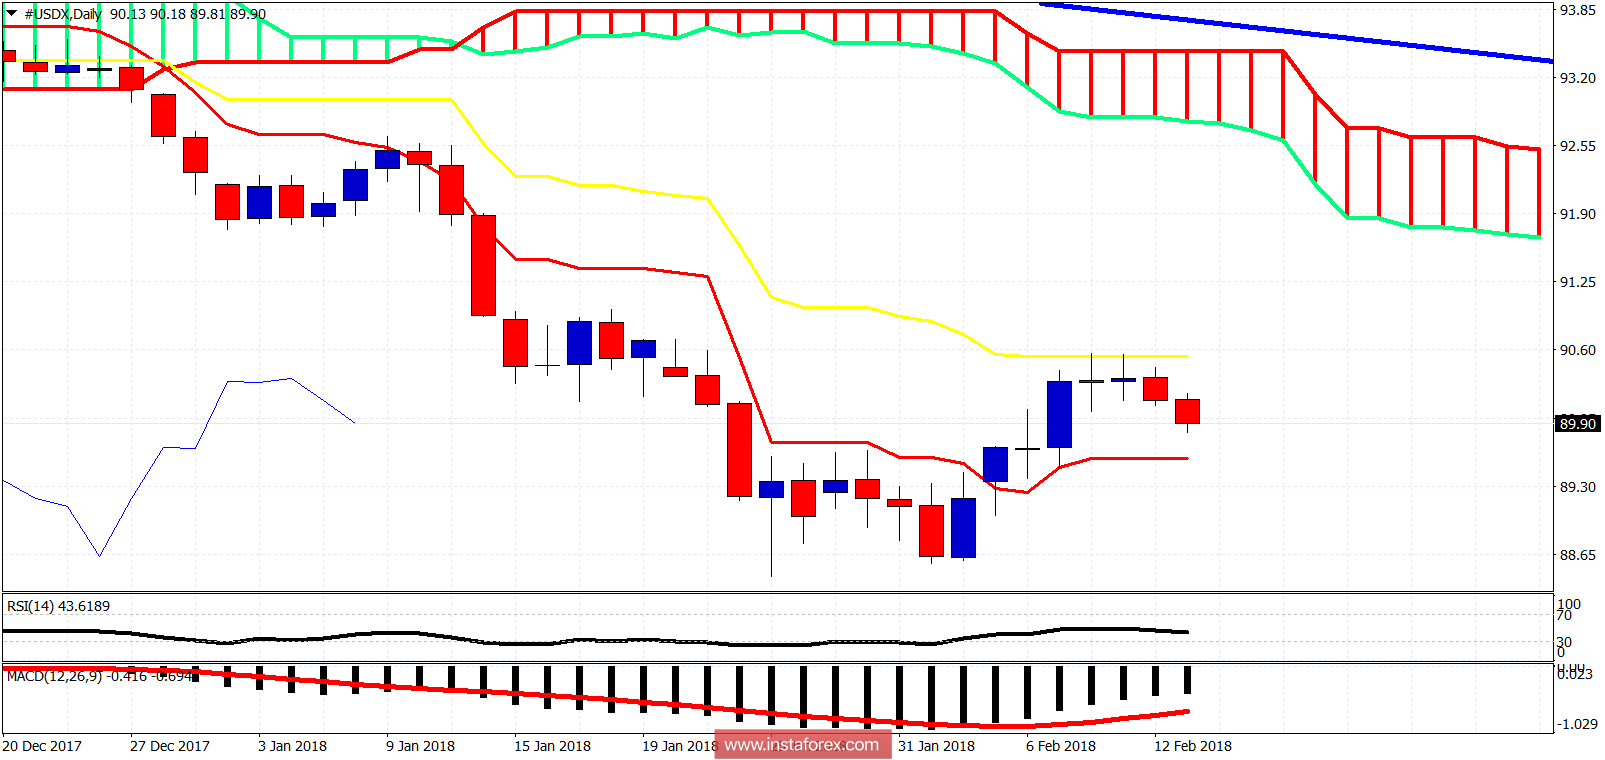
On a daily basis, the Dollar index got rejected at the kijun-sen and is heading towards the tenkan-sen (red line indicator) support. Daily trend remains bearish. Support on a daily basis is at 89.60. A daily close below it will be a bearish sign.