 English
  Русский
 Bahasa Indonesia
 Bahasa Malay
 ไทย
ไทย Español
 Deutsch
 Български
 Français
 Tiếng Việt
 中文
中文 বাংলা
বাংলা हिन्दी
 Čeština
 Українська
 Română

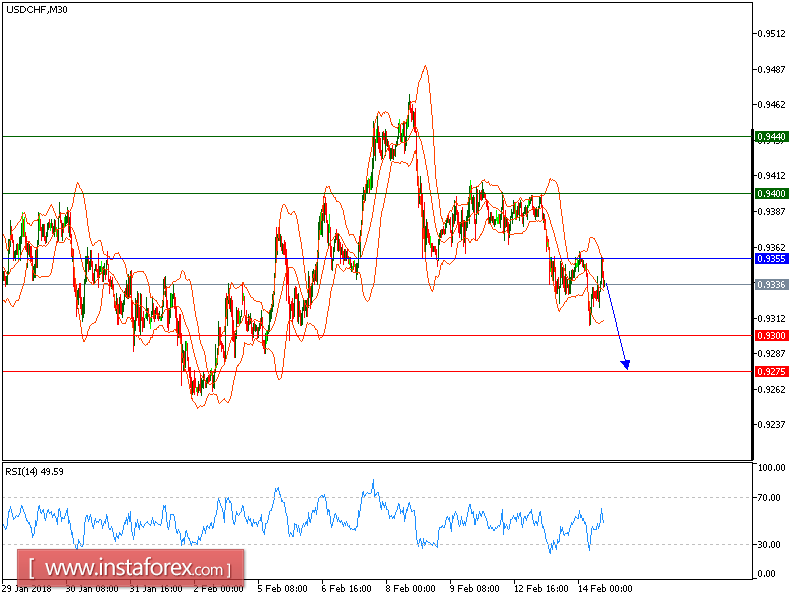
USD/CHF is expected to trade with a bearish outlook as far as 0.9355 is resistance. Despite the recent rebound, the pair is still trading below the declining 50-period moving average, which is playing a resistance role. Even though a continuation of the technical rebound cannot be ruled out, its extent should be limited.
Therefore, as long as 0.9355 is not surpassed, look for a new decline with targets at 0.9300 and 0.9275 in extension.
Chart Explanation: The black line shows the pivot point. The present price above the pivot point indicates a bullish position, and the price below the pivot point indicates a short position. The red lines show the support levels, and the green line indicates the resistance levels. These levels can be used to enter and exit trades.
Strategy: SELL, stop loss at 0.9355, take profit at 0.9300.
Resistance levels: 0.9400, 0.9440, and 0.9480
Support levels: 0.9300, 0.9275, and 0.9240.