 English
  Русский
 Bahasa Indonesia
 Bahasa Malay
 ไทย
ไทย Español
 Deutsch
 Български
 Français
 Tiếng Việt
 中文
中文 বাংলা
বাংলা हिन्दी
 Čeština
 Українська
 Română

The pair pierced above the 200 SMA and now it's looking to consolidate gains in an effort to test the resistance zone of 1.4078. Around that area, we can expect some offers to be triggered in order to resume the bearish bias towards the 1.3753 level. If GBP/USD manages to break it, then the next target would be placed at 1.3604.
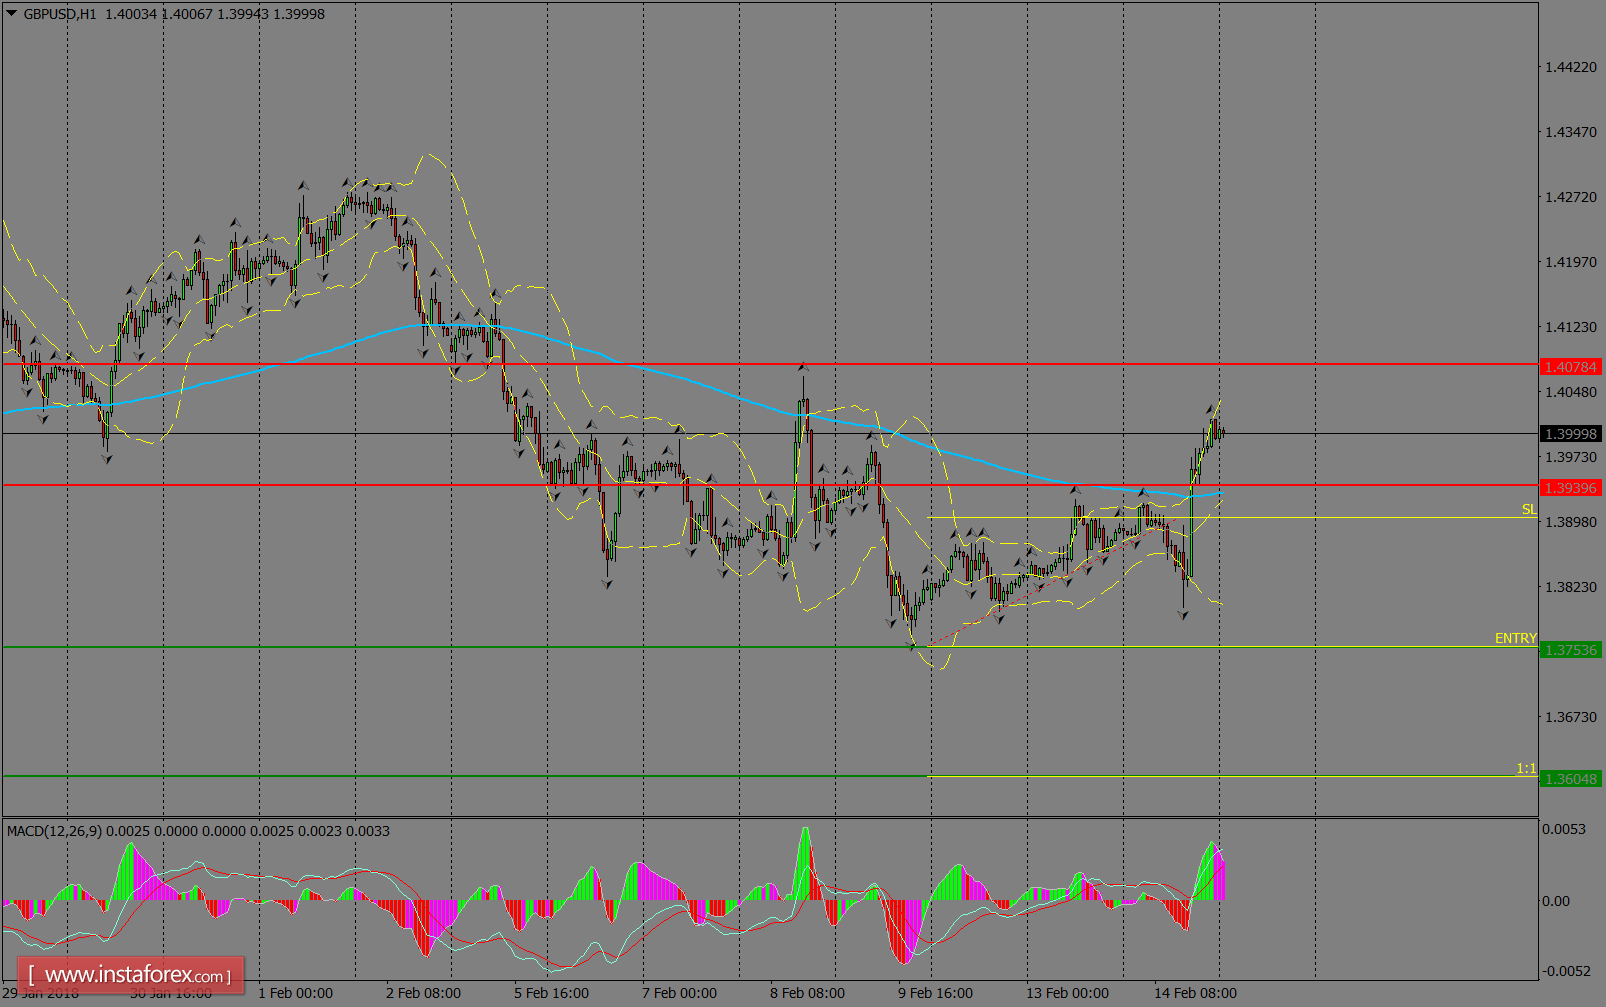
H1 chart's resistance levels: 1.3939 / 1.4078
H1 chart's support levels: 1.3753 / 1.3604
Trading recommendations for today: Based on the H1 chart, sell (short) orders only if the GBP/USD pair breaks a bearish candlestick; the resistance level is at 1.3753, take profit is at 1.3604 and stop loss is at 1.3903.