 English
  Русский
 Bahasa Indonesia
 Bahasa Malay
 ไทย
ไทย Español
 Deutsch
 Български
 Français
 Tiếng Việt
 中文
中文 বাংলা
বাংলা हिन्दी
 Čeština
 Українська
 Română

USDX is extending losses across the board after having found dynamic resistance in the 200 SMA at H1 chart. Currently, the index is breaking lower below the support zone of 89.36 and it's on the way to reach the level of 87.88 as the next key target. However, if a rebound happens at the current stage, then it might resume the bullish bias to reach the 90.63 level.
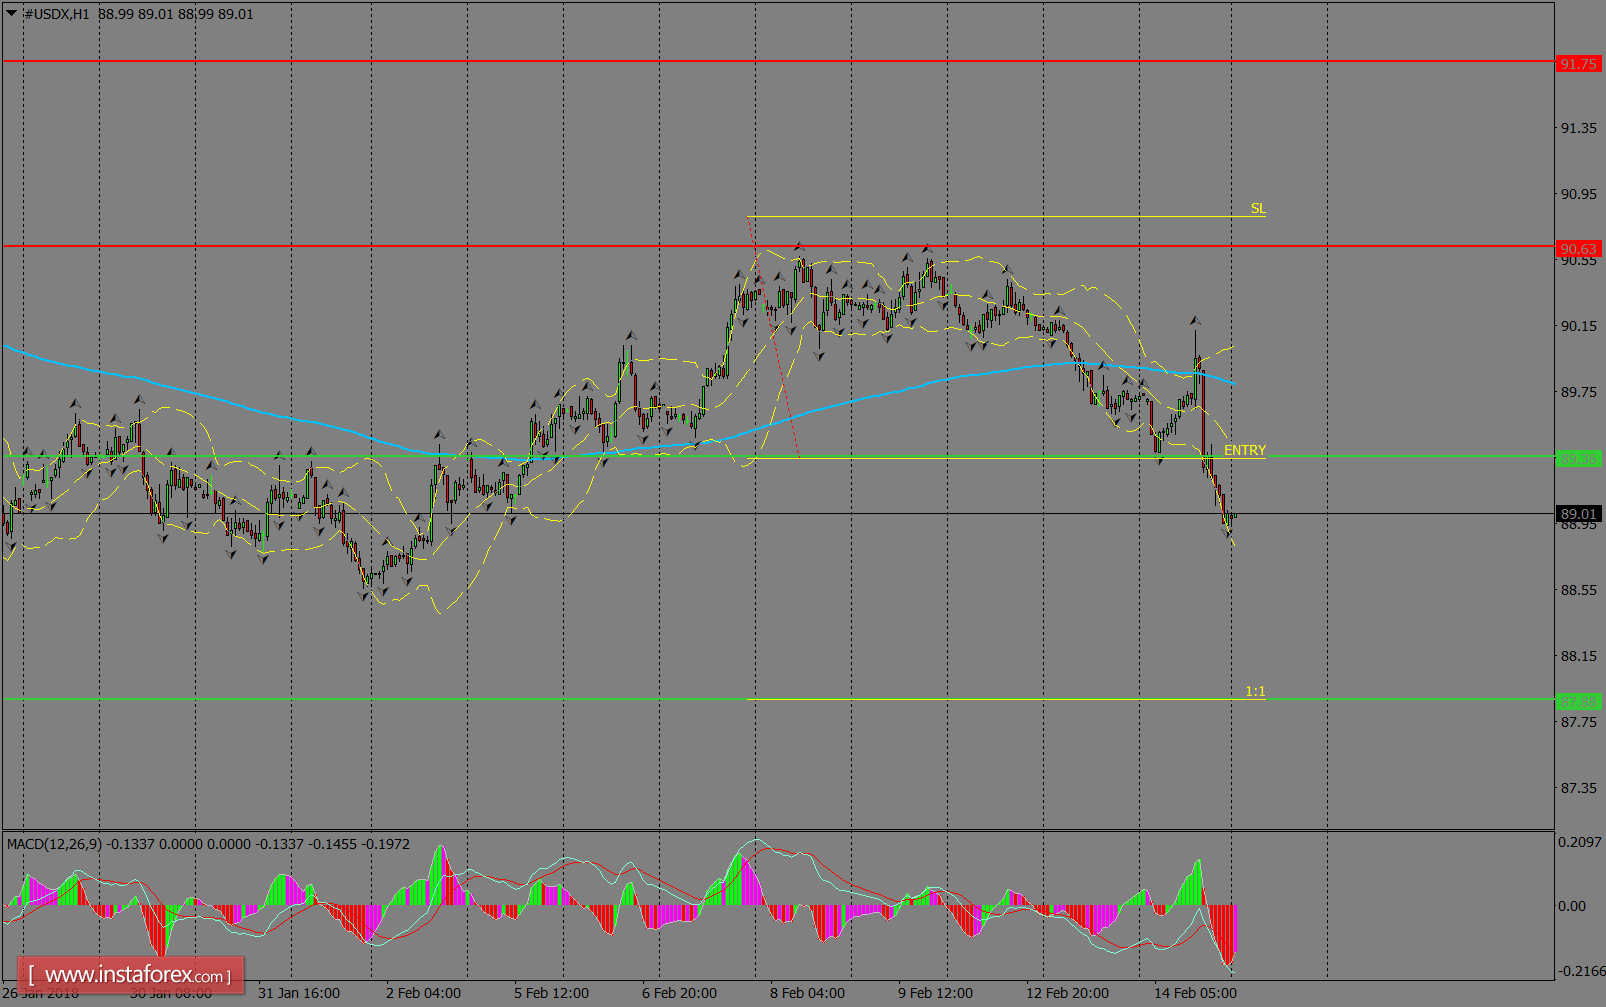
H1 chart's resistance levels: 90.63 / 91.75
H1 chart's support levels: 89.36 / 87.88
Trading recommendations for today: Based on the H1 chart, place sell (short) orders only if the USD Index breaks with a bearish candlestick; the support level is at 89.36, take profit is at 87.88 and stop loss is at 90.81.