 English
  Русский
 Bahasa Indonesia
 Bahasa Malay
 ไทย
ไทย Español
 Deutsch
 Български
 Français
 Tiếng Việt
 中文
中文 বাংলা
বাংলা हिन्दी
 Čeština
 Українська
 Română

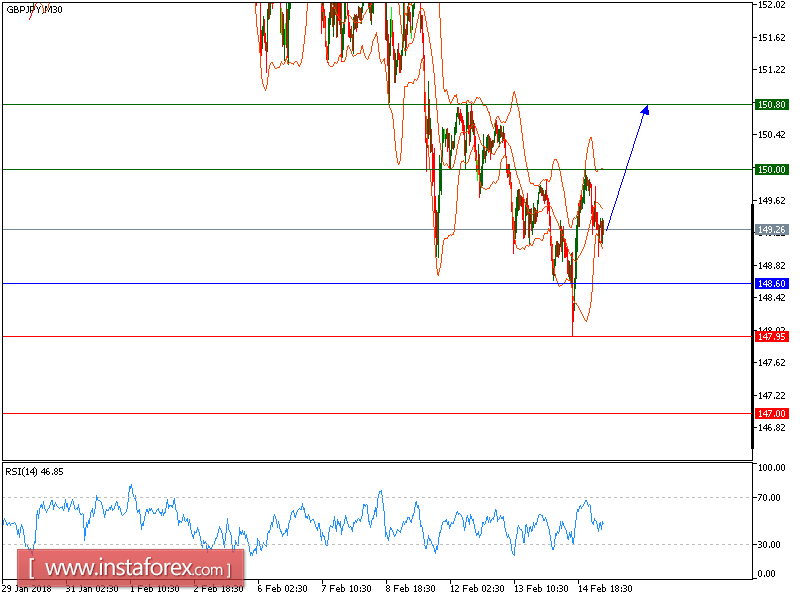
Our first target which we predicted in the yesterday's analysis has been hit. GBP/JPY is expected to trade with bullish bias above 148.60. Although the pair posted a pullback from 150.80, it is still supported by a bullish trend line. A support base at 148.60 has formed and has allowed for a temporary stabilization. The relative strength index is above its neutrality level at 50.
Therefore, as long as 148.60 is not broken, look for a new upside with targets at 150.00 and 150.80 in extension.
Alternatively, if the price moves in the direction opposite to the forecast, a short position is recommended to be below 148.60 with the target at 150.00.
Strategy: BUY, Stop loss at 148.60, Take profit at 150.00
Chart Explanation: the black line shows the pivot point. The price above the pivot point indicates long positions; and when it is below the pivot point, it indicates short positions. The red lines show the support levels, and the green line indicates the resistance levels. These levels can be used to enter and exit trades.
Resistance levels: 150.00, 150.80, and 151.50
Support levels: 147.95, 147.00, and 146.30.