 English
  Русский
 Bahasa Indonesia
 Bahasa Malay
 ไทย
ไทย Español
 Deutsch
 Български
 Français
 Tiếng Việt
 中文
中文 বাংলা
বাংলা हिन्दी
 Čeština
 Українська
 Română

GBP/USD has been consolidating gains above the 200 SMA at H1 chart and having a break above the 1.3939 level, then we might expect a rally to test the 1.4209 level. At the current stage, it's likely to see a pullback to resume the bearish bias once again. MACD indicator remains slightly in the neutral territory, calling for further consolidation.
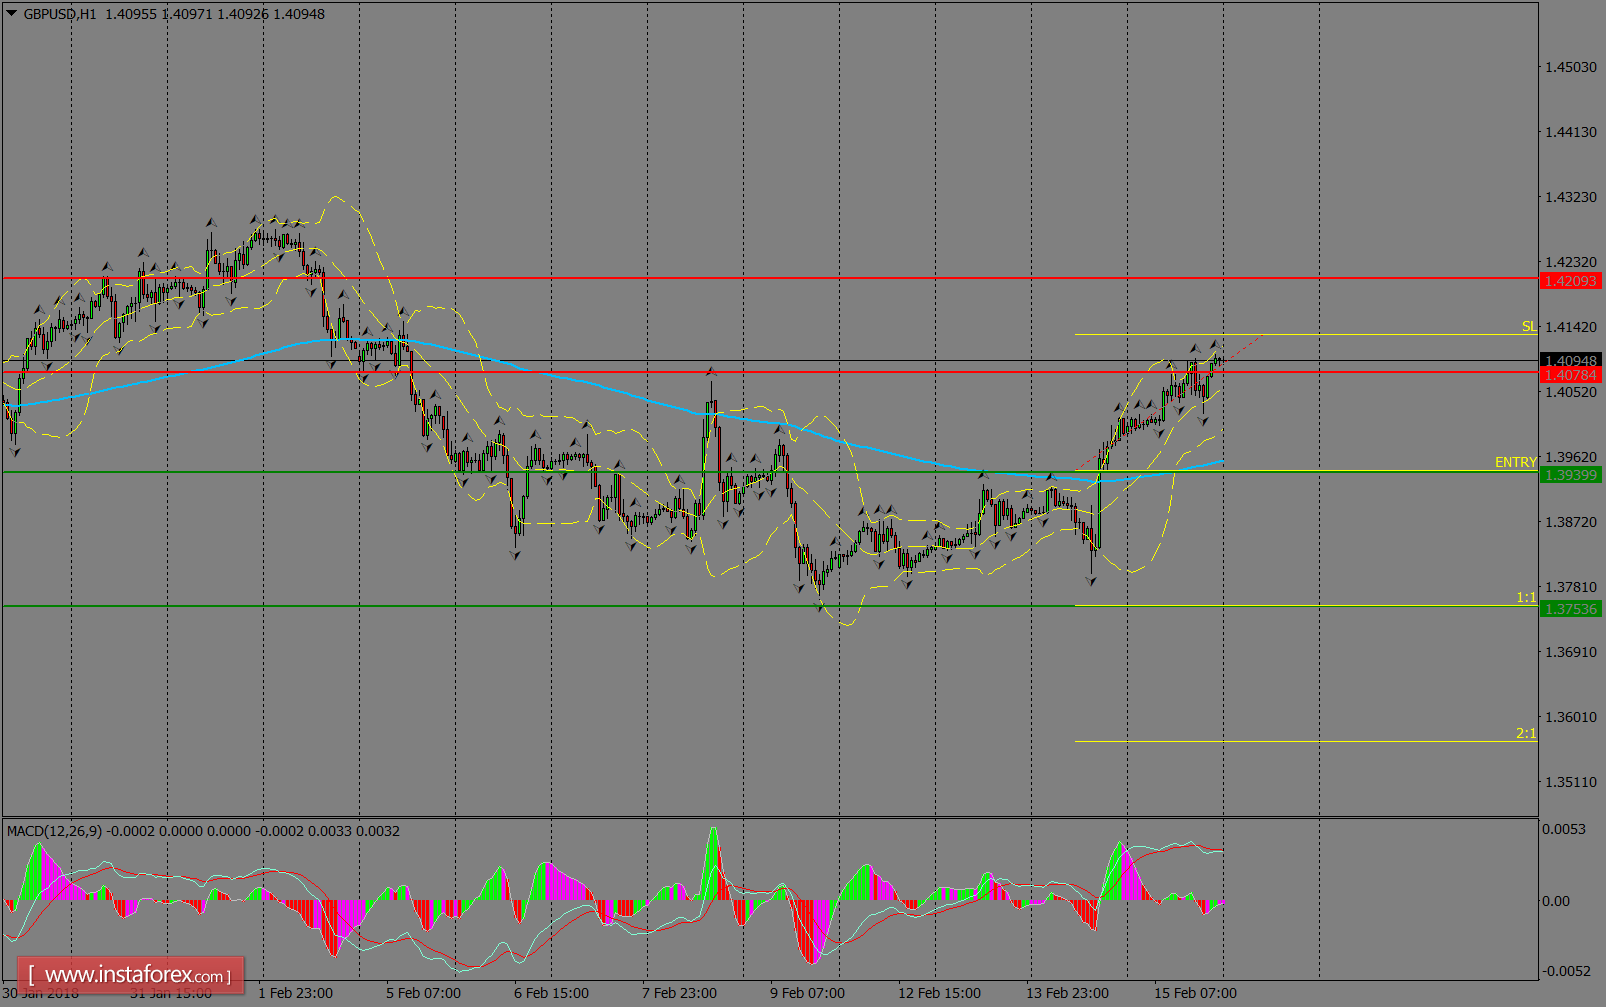
H1 chart's resistance levels: 1.4078 / 1.4209
H1 chart's support levels: 1.3939 / 1.3753
Trading recommendations for today: Based on the H1 chart, sell (short) orders only if the GBP/USD pair breaks a bearish candlestick; the resistance level is at 1.3939, take profit is at 1.3753, and stop loss is at 1.4130.