 English
  Русский
 Bahasa Indonesia
 Bahasa Malay
 ไทย
ไทย Español
 Deutsch
 Български
 Français
 Tiếng Việt
 中文
中文 বাংলা
বাংলা हिन्दी
 Čeština
 Українська
 Română

The pair has already made a pullback around the 1.4150 level across the board and looks forward to test the 200 SMA at H1 chart. There are fractals formed around that area, which should provide support in the near-term to produce a rebound in order to resume the bullish bias. If it manages to break above 1.4078, then the next area would be the 1.4209 level.
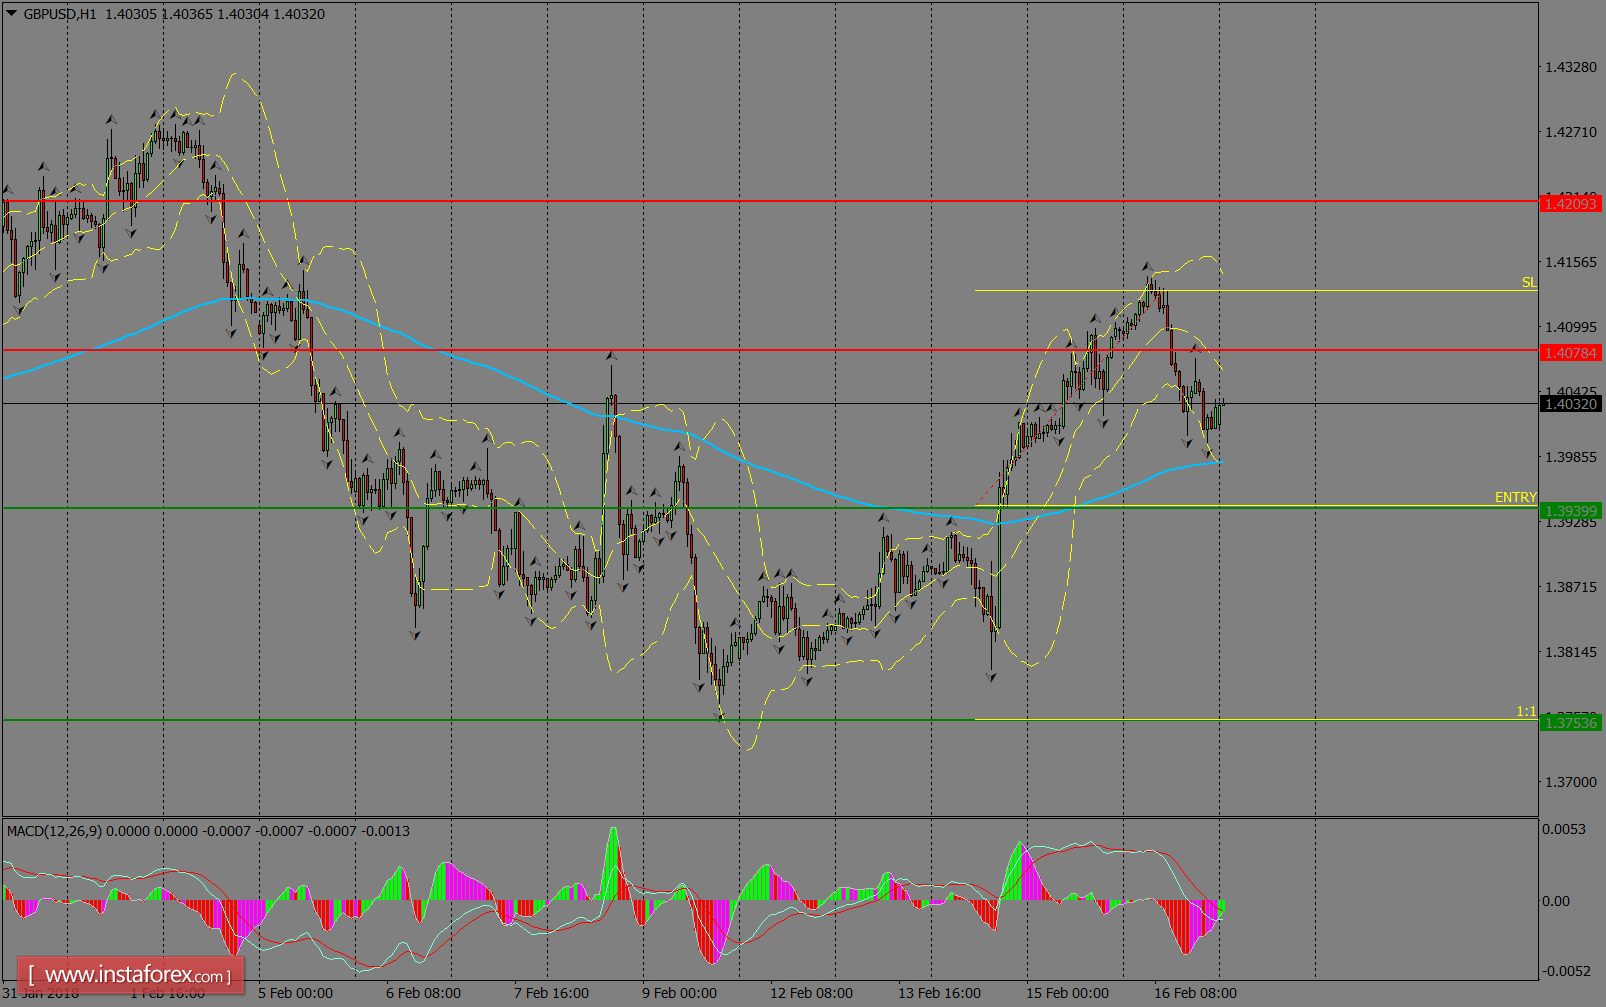
H1 chart's resistance levels: 1.4078 / 1.4209
H1 chart's support levels: 1.3939 / 1.3753
Trading recommendations for today: Based on the H1 chart, sell (short) orders only if the GBP/USD pair breaks a bearish candlestick; the resistance level is at 1.3939, take profit is at 1.3753, and stop loss is at 1.4130.