 English
  Русский
 Bahasa Indonesia
 Bahasa Malay
 ไทย
ไทย Español
 Deutsch
 Български
 Français
 Tiếng Việt
 中文
中文 বাংলা
বাংলা हिन्दी
 Čeština
 Українська
 Română

Overview:
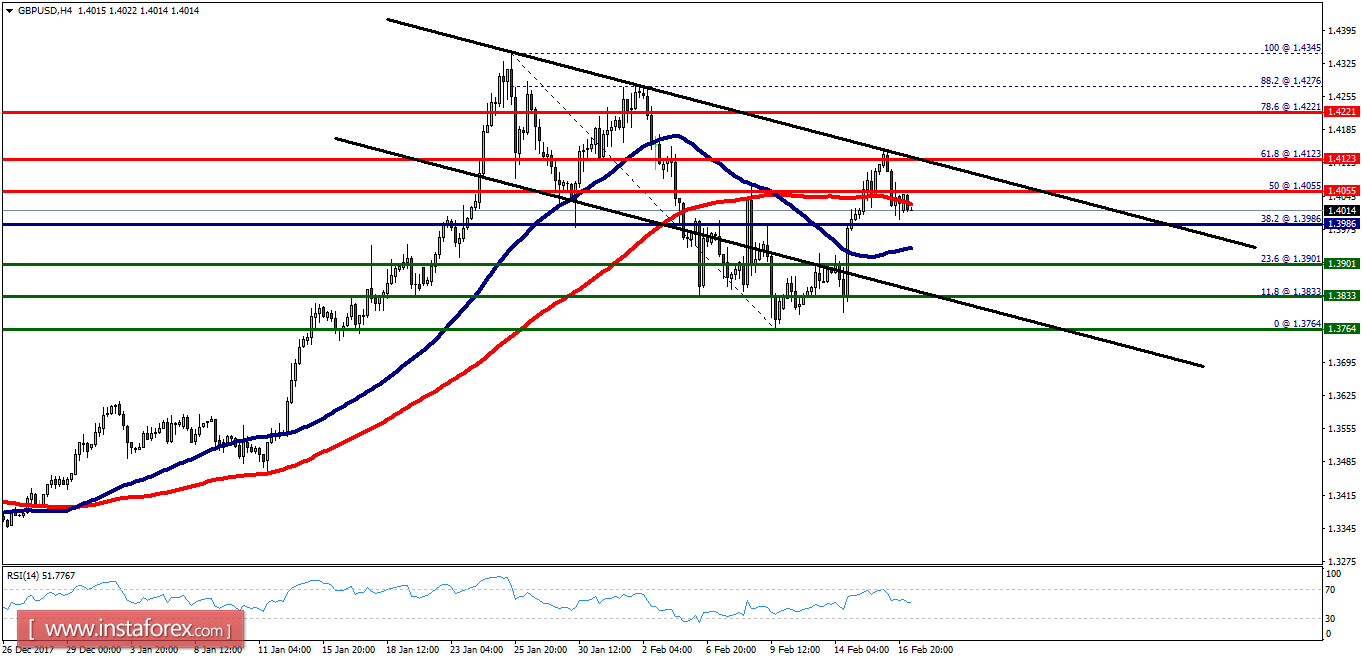
- The GBP/USD pair opened below the resistance of 1.4055. It continued to move downwards from the level of 1.4055 to the bottom around 1.4015. Today, the first resistance level is seen at 1.4055 followed by 1.4123, while the daily support 1 is seen at 1.3901. Furthermore, the moving average (100) starts signaling a downward trend; therefore, the market is indicating a bearish opportunity below 1.4055. So it will be good to sell at 1.4055 with the first target of 1.3986. It will also call for a downtrend in order to continue towards 1.3901. The strong daily support is seen at the 1.3901 level. According to the previous events, we expect the GBP/USD pair to trade between 1.4055 and 1.3901 in the coming hours. The price area of 1.4123 remains a significant resistance zone. Thus, the trend is still bearish as long as the level of 1.4123 is not broken. On the contrary, in case a reversal takes place and the GBP/USD pair breaks through the resistance level of 1.4123, then a stop loss should be placed at 1.4160.