 English
  Русский
 Bahasa Indonesia
 Bahasa Malay
 ไทย
ไทย Español
 Deutsch
 Български
 Français
 Tiếng Việt
 中文
中文 বাংলা
বাংলা हिन्दी
 Čeština
 Українська
 Română

GBP/USD didn't manage to consolidate below the support zone of 1.3939 following a false breakout on February 22. The 200 SMA is still offering dynamic resistance and if it manages to break above this indicator, the next target will lie at 1.4078. MACD indicator still supports the bullish scenario in the short term.
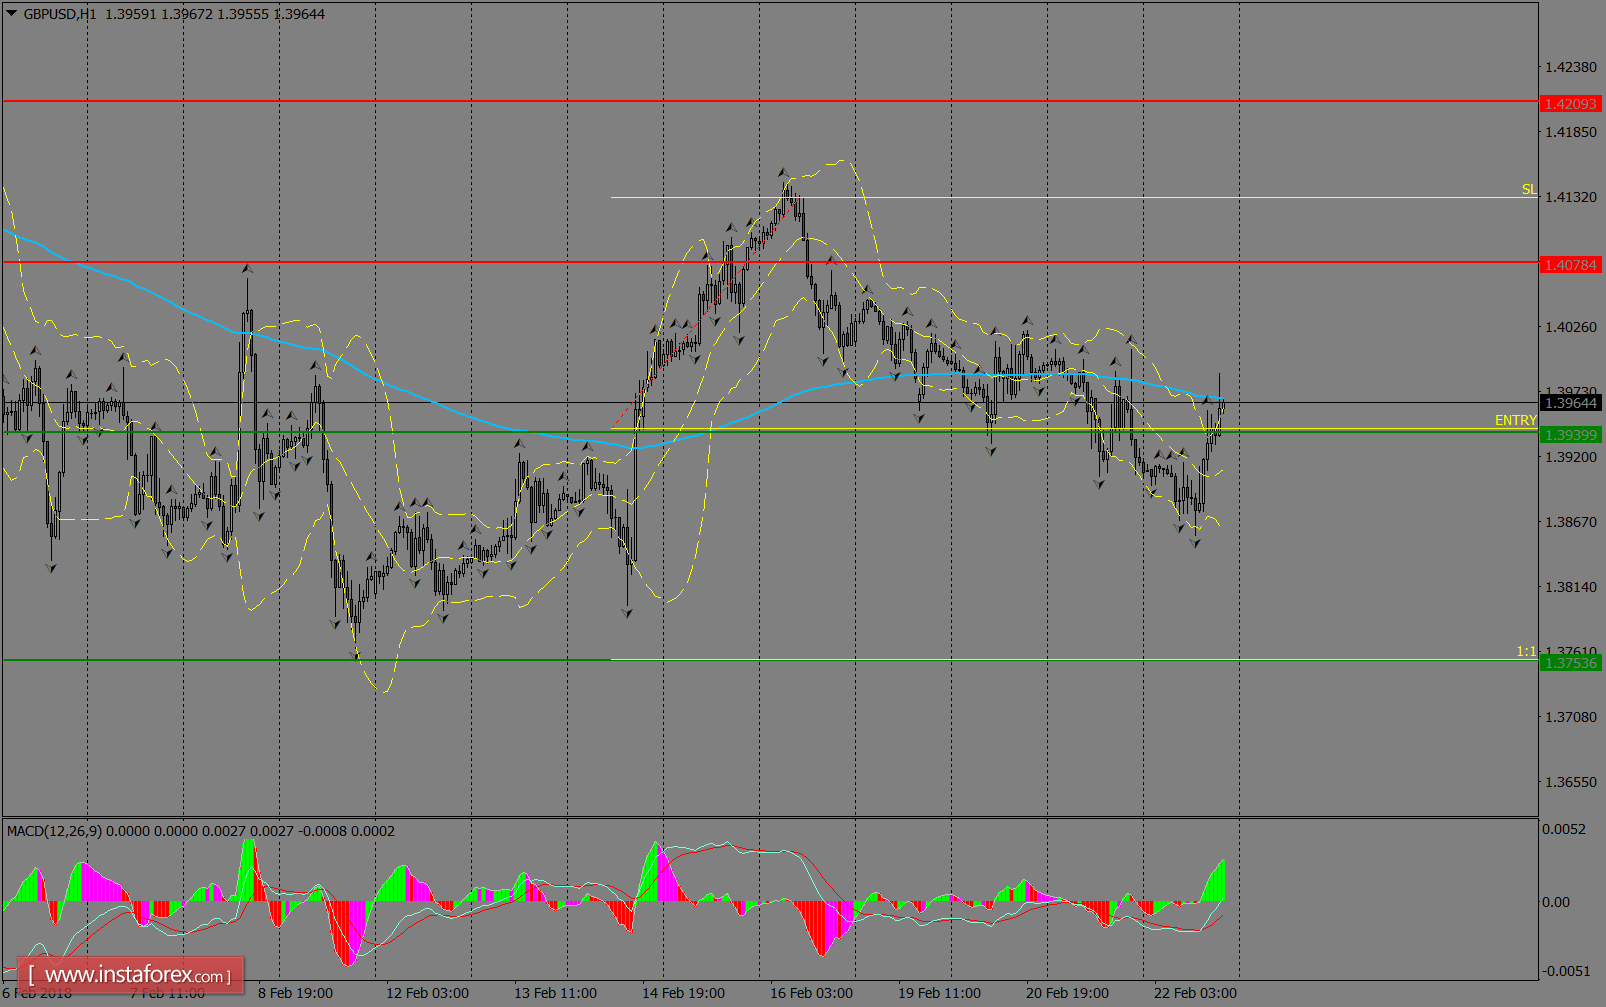
H1 chart's resistance levels: 1.4078 / 1.4209
H1 chart's support levels: 1.3939 / 1.3753
Trading recommendations for today: Based on the H1 chart, place sell (short) orders only if the GBP/USD pair breaks a bearish candlestick; the resistance level is at 1.3939, take profit is at 1.3753 and stop loss is at 1.4130.