 English
  Русский
 Bahasa Indonesia
 Bahasa Malay
 ไทย
ไทย Español
 Deutsch
 Български
 Français
 Tiếng Việt
 中文
中文 বাংলা
বাংলা हिन्दी
 Čeština
 Українська
 Română

The gold price bounced yesterday towards the first important resistance at $1,334 but there are signs of rejection. The price is in a bearish short-term trend as we are now again below the 4-hour Ichimoku cloud.
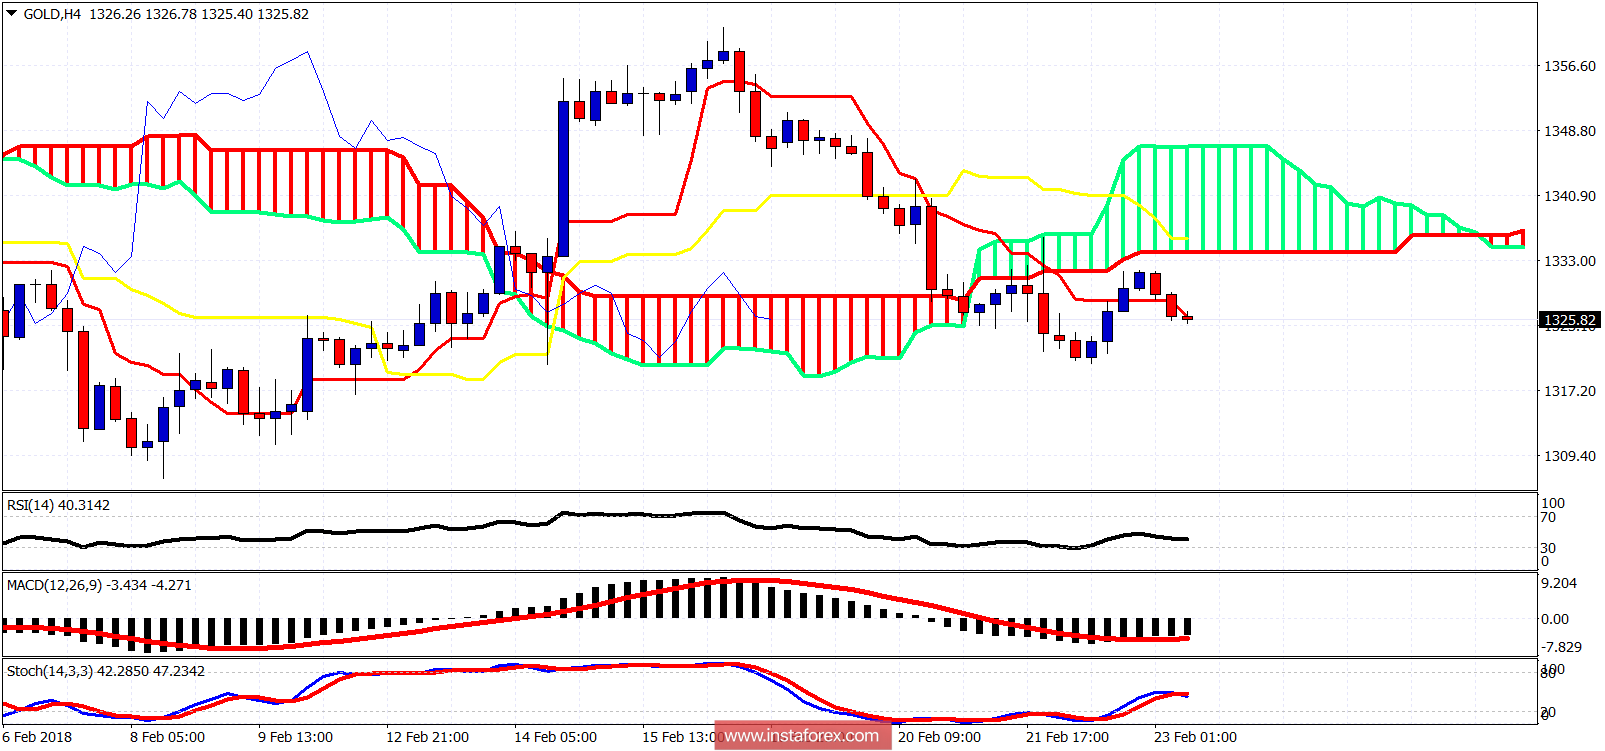
The gold price moved above the 4-hour tenkan-sen briefly but got rejected at the lower cloud boundary. The price is now again below the tenkan-sen. The trend is clearly bearish in the short term. Support is at the recent low of $1,320. Resistance is at $1,334 and next at $1,335.60. A break above $1,335.60 will open the way for a move towards the upper cloud boundary at $1,346.
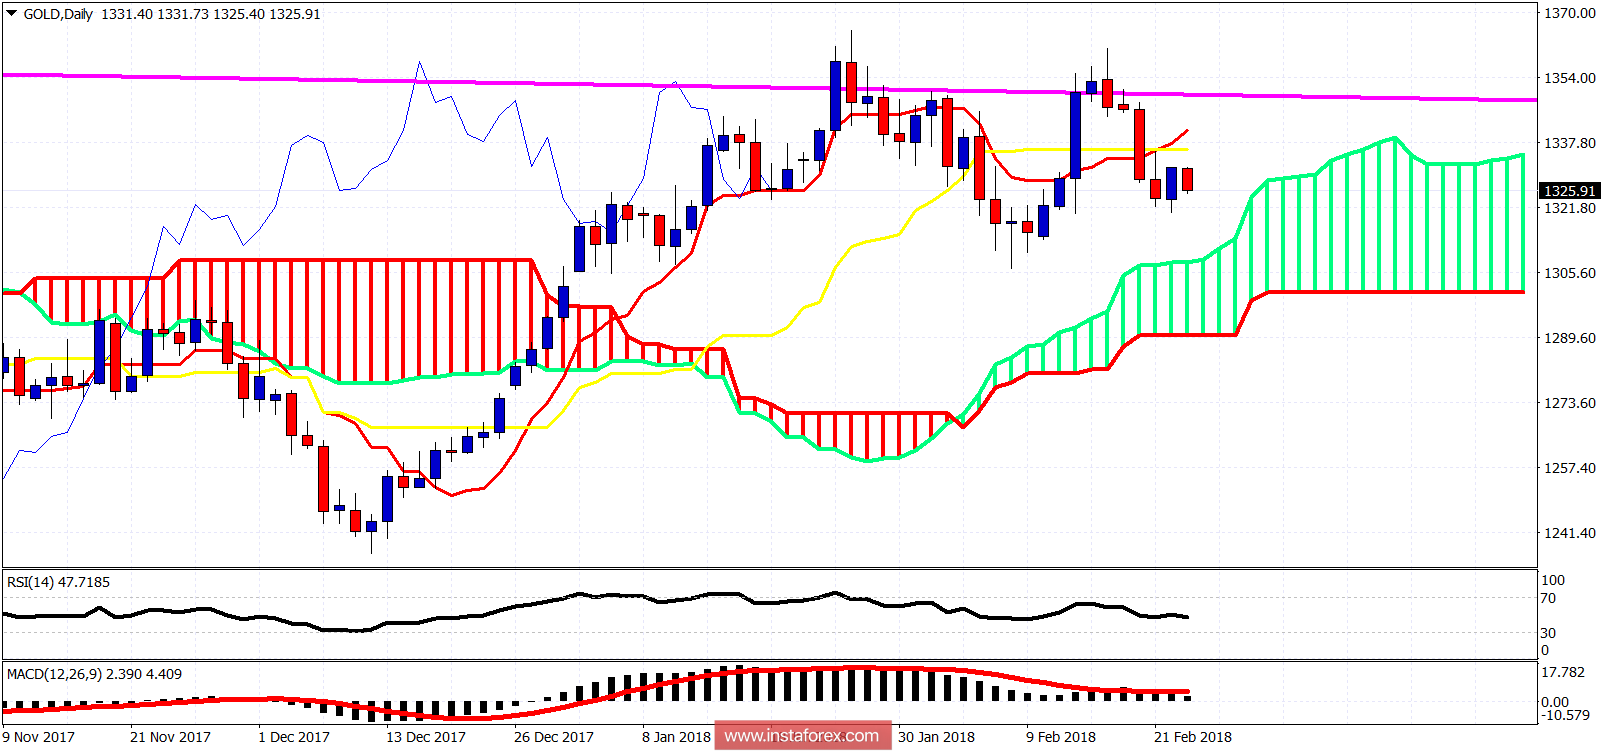
On a daily basis, the gold price has made a double top at $1,355. The price is again below both the tenkan- and kijun-sen indicators. The price is heading towards the cloud support at $1,300. Resistance is at $1,340. So far the price has made a higher low relative to the February low on the 8th. As long as the price is above the low from the 8th, a break higher would be very bullish.