 English
  Русский
 Bahasa Indonesia
 Bahasa Malay
 ไทย
ไทย Español
 Deutsch
 Български
 Français
 Tiếng Việt
 中文
中文 বাংলা
বাংলা हिन्दी
 Čeština
 Українська
 Română

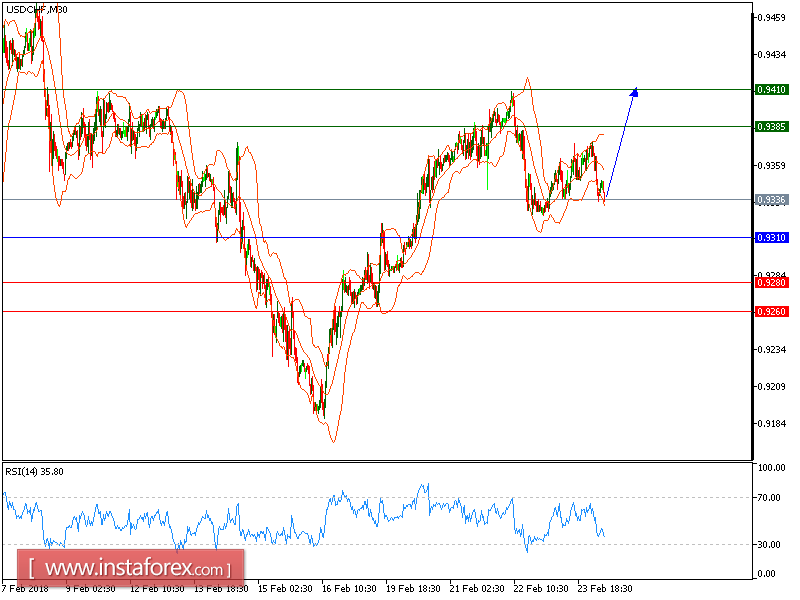
USD/CHF is expected to trade with bullish outlook. The pair managed to hold above its key support at 0.9310, and also remains bullish, backed by its ascending trend line. Besides, a bullish cross has been identified between the 20-period and 50-period moving averages. Furthermore, the relative strength index is turning up, and calls for a new rise.
To conclude, as long as 0.9310 holds on the downside, look for 0.9385 and 0.9410 in extension.
Chart Explanation: The black line shows the pivot point. The present price above the pivot point indicates a bullish position, and the price below the pivot point indicates a short position. The red lines show the support levels, and the green line indicates the resistance levels. These levels can be used to enter and exit trades.
Strategy: BUY, stop loss at 0.9310, take profit at 0.9385.
Resistance levels: 0.9385, 0.9410, and 0.9455
Support levels: 0.9280, 0.9260, and 0.9215.