 English
  Русский
 Bahasa Indonesia
 Bahasa Malay
 ไทย
ไทย Español
 Deutsch
 Български
 Français
 Tiếng Việt
 中文
中文 বাংলা
বাংলা हिन्दी
 Čeština
 Українська
 Română

GBP/USD gained momentum across the board during the Monday's session and is consolidating the price action above the 200 SMA; a move which should put in focus the resistance zone of 1.4078 as the next target to the upside. If it manages to break it, then the next step would be the 1.4209 level, while a pullback should make a testing of the 1.3939 zone.
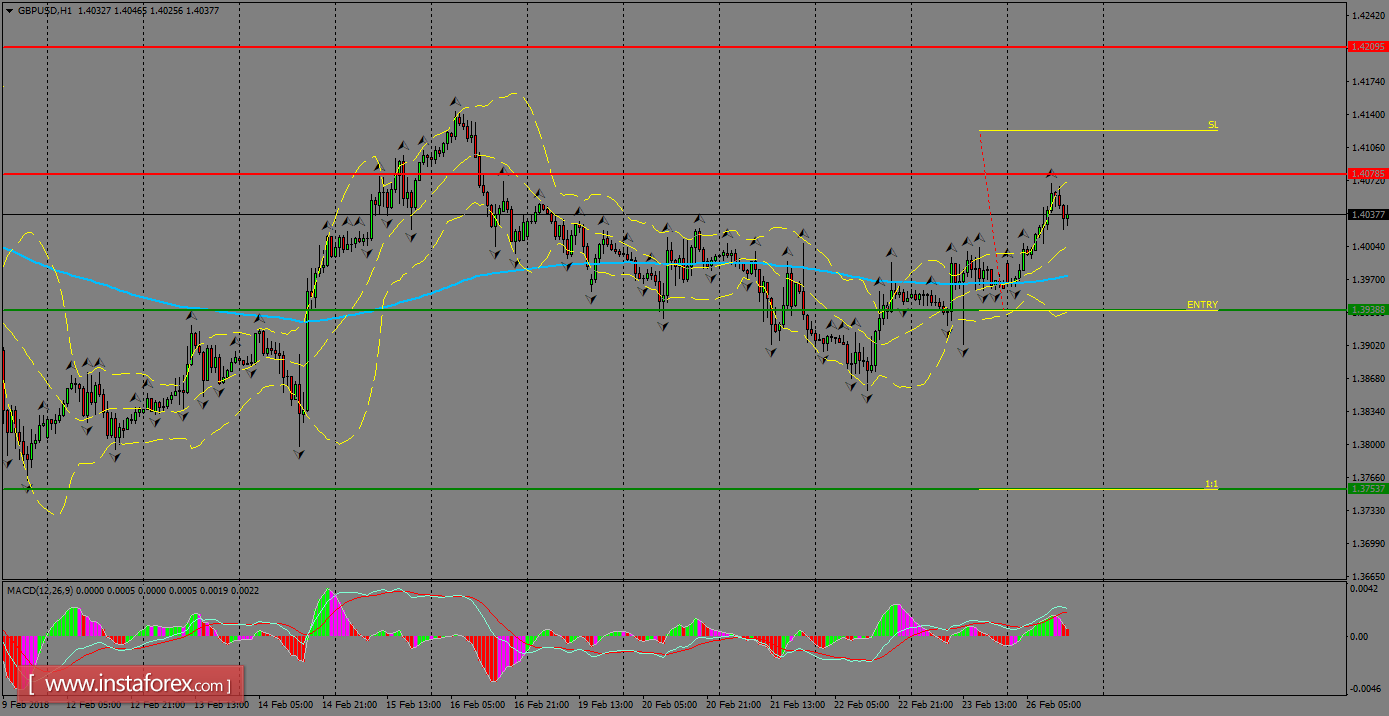
H1 chart's resistance levels: 1.4078 / 1.4209
H1 chart's support levels: 1.3939 / 1.3753
Trading recommendations for today: Based on the H1 chart, sell (short) orders only if the GBP/USD pair breaks a bearish candlestick; the resistance level is at 1.3939, take profit is at 1.3753, and stop loss is at 1.4130.