 English
  Русский
 Bahasa Indonesia
 Bahasa Malay
 ไทย
ไทย Español
 Deutsch
 Български
 Français
 Tiếng Việt
 中文
中文 বাংলা
বাংলা हिन्दी
 Čeština
 Українська
 Română

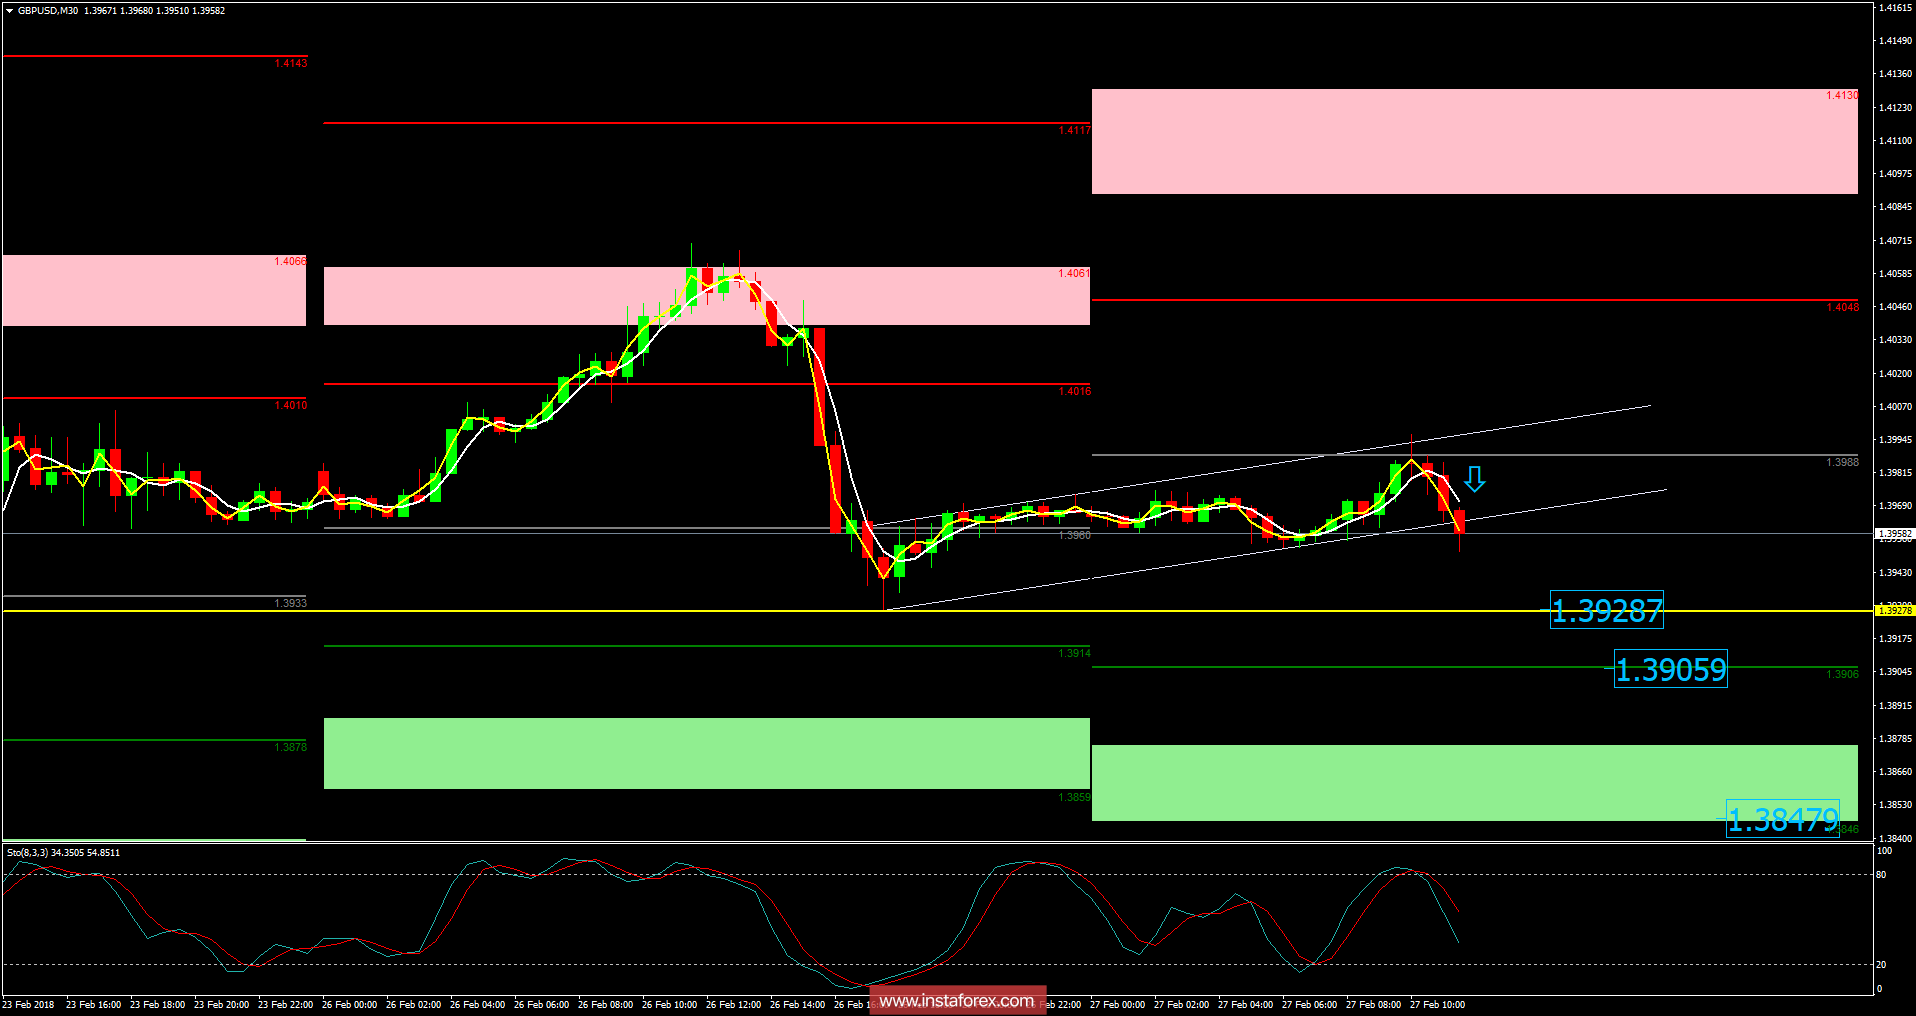
Recently, the GBP/USD pair has been trading sideways at the price of 1.3958. Anyway, according to the 30M time – frame, I found a broken intraday bearish flag pattern, which is a sign that sellers are in control. I also found an overbought condition on the stochastic oscillator, which is another sign of weakness. My avice is to watch for potential selling opportunities. The downward targets are set at the price of 1.3928, 1.3905 and at the price of 1.3848.
Resistance levels:
R1: 1.4048
R2: 1.4130
R3: 1.4190
Support levels:
S1: 1.3905
S2: 1.3847
S3: 1.3765
Trading recommendations for today: watch for potential selling opportunities.