 English
  Русский
 Bahasa Indonesia
 Bahasa Malay
 ไทย
ไทย Español
 Deutsch
 Български
 Français
 Tiếng Việt
 中文
中文 বাংলা
বাংলা हिन्दी
 Čeština
 Українська
 Română

The Dollar index has broken through the previous high at 90.60. Short-term trend remains bullish. Next important resistance is found at 90.85 where we find the 38% Fibonacci retracement.
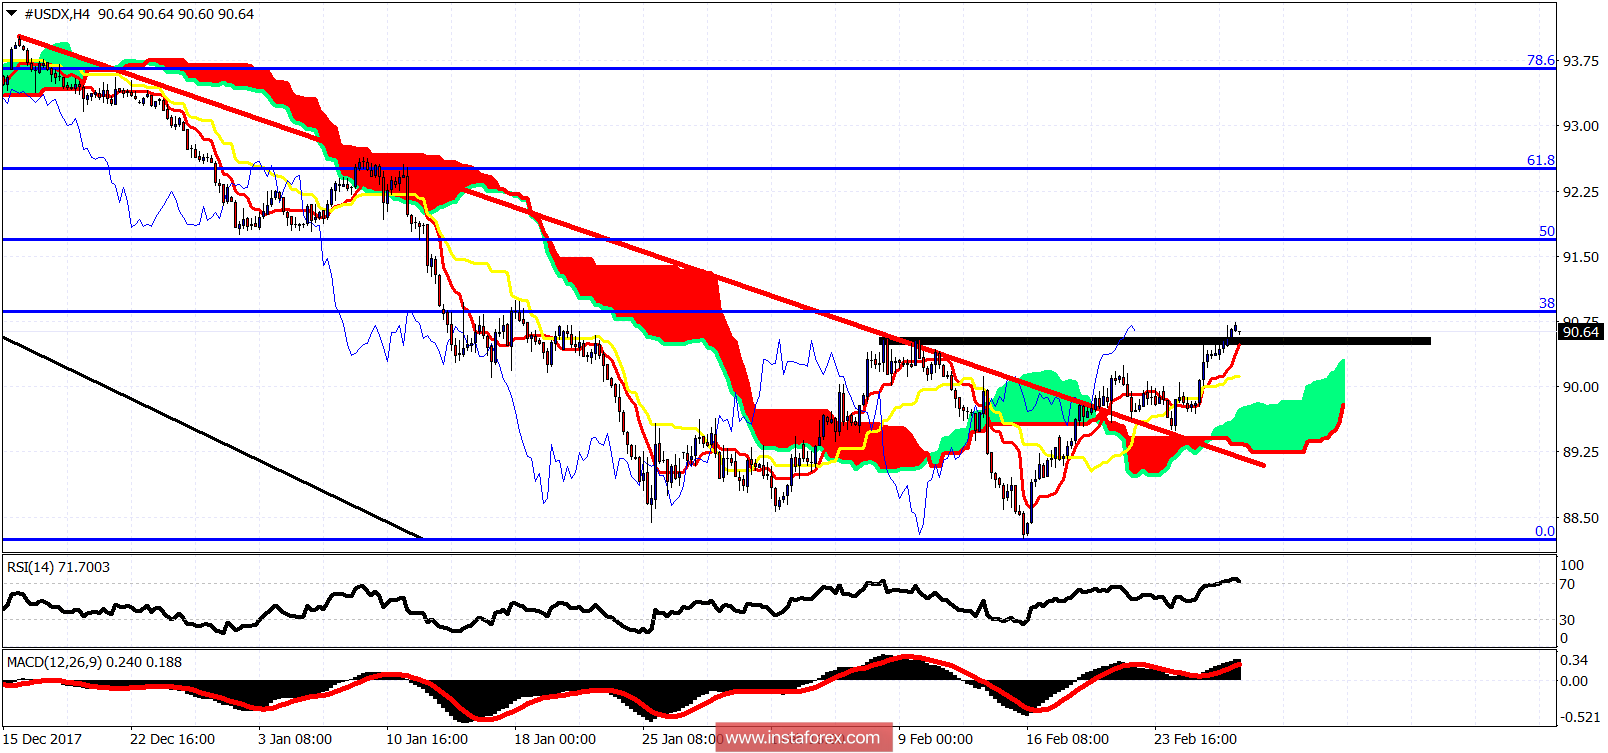
Black line - resistance (broken)
The Dollar index is breaking above the short-term resistance levels and continues to trade above both the tenkan- and kijun-sen indicators. Support is at 90.10 and at 89.80. Bulls do not want to see these two levels broken. Above the 38% Fibonacci retracement resistance, we have the 91.75 and 92.45 levels as very important resistance levels.
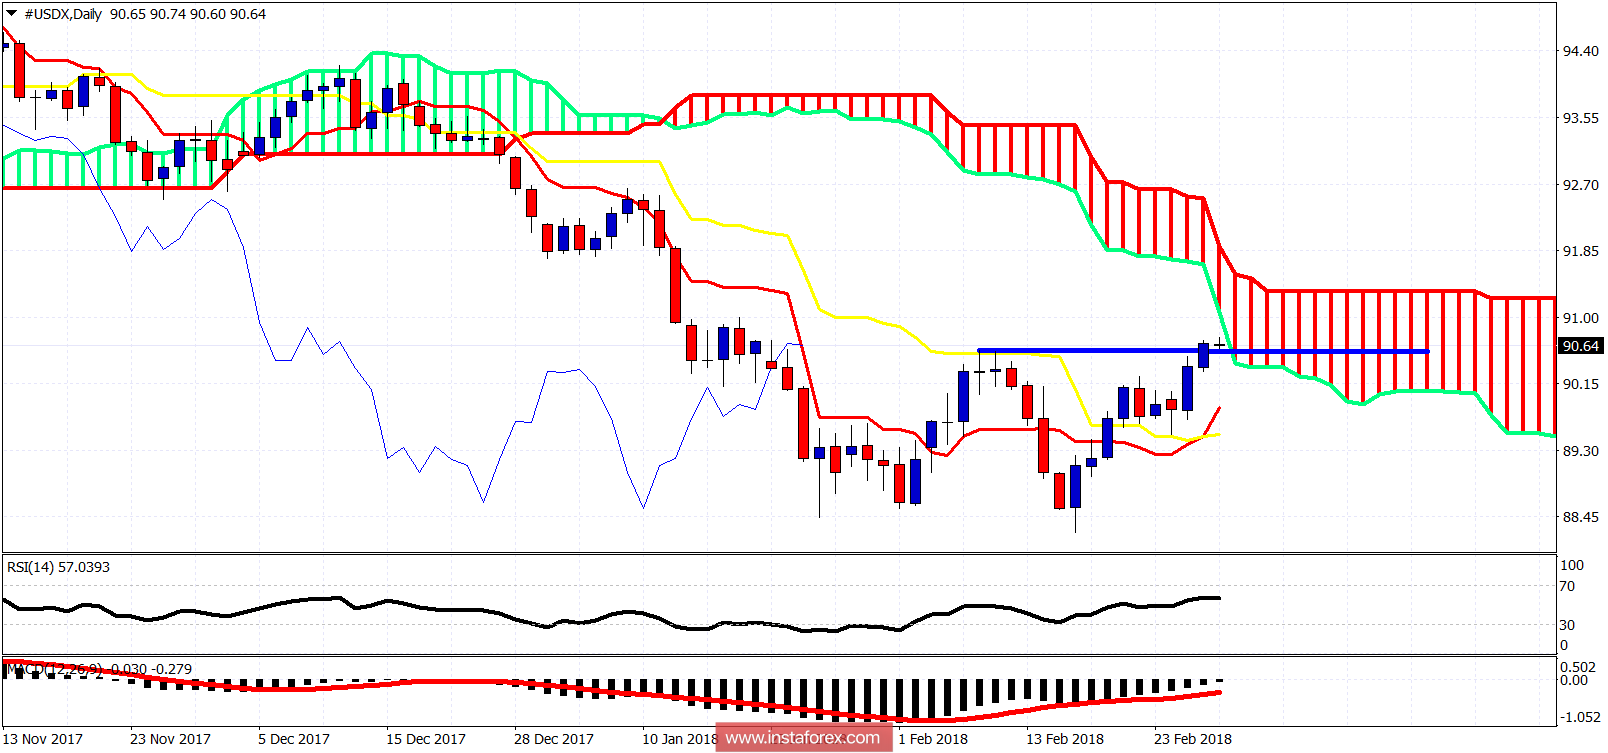
Daily trend remains bearish as price remains below the Kumo. Price is now challenging cloud resistance in the Daily chart. Daily support is at 90.50-90.25 and at 89.80. Bulls need to be careful as we might see a rejection at the Daily cloud resistance.