 English
  Русский
 Bahasa Indonesia
 Bahasa Malay
 ไทย
ไทย Español
 Deutsch
 Български
 Français
 Tiếng Việt
 中文
中文 বাংলা
বাংলা हिन्दी
 Čeština
 Українська
 Română

The pair is extending losses across the board and the price action is moving below the 200 SMA at H1 chart. Currently, GBP/USD is forming a lower low pattern that could allow another leg lower towards the support zone of 1.3608, once the 1.3753 level gives up to the bearish force. MACD indicator stays in the positive territory, which could favor to a rebound.
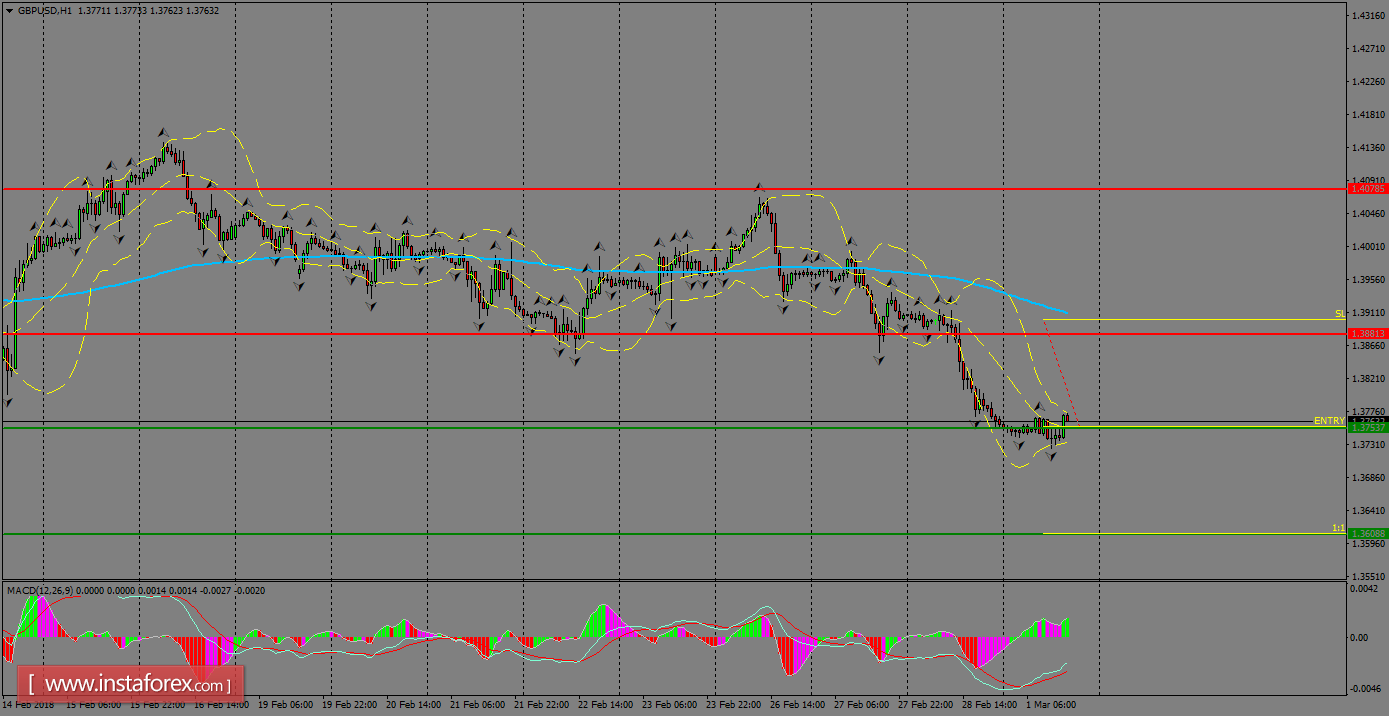
H1 chart's resistance levels: 1.3881 / 1.4078
H1 chart's support levels: 1.3753 / 1.3608
Trading recommendations for today: Based on the H1 chart, sell (short) orders only if the GBP/USD pair breaks a bearish candlestick; the resistance level is at 1.3753, take profit is at 1.3608, and stop loss is at 1.3901.