 English
  Русский
 Bahasa Indonesia
 Bahasa Malay
 ไทย
ไทย Español
 Deutsch
 Български
 Français
 Tiếng Việt
 中文
中文 বাংলা
বাংলা हिन्दी
 Čeština
 Українська
 Română

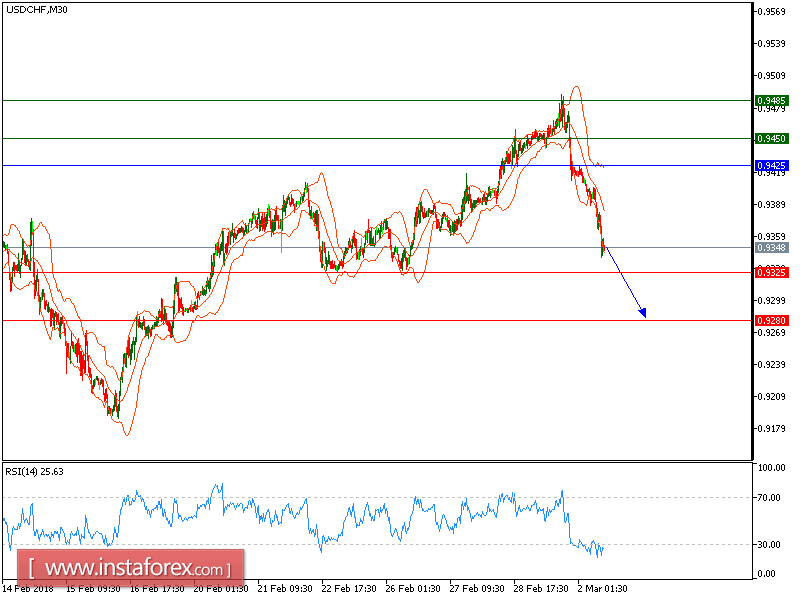
USD/CHF is under pressure. The pair broke below its intraday bullish channel, and is likely to post new weaknesses. A bearish cross has just been identified between the 20-period and 50-period moving averages. Last but not least, the relative strength index is heading downward, without showing any reversal signal.
In which case, as long as 0.9425 is resistance, further decline seems to be on the cards to 0.9325 and 0.9280 in extension.
Chart Explanation: The black line shows the pivot point. The present price above the pivot point indicates a bullish position, and the price below the pivot point indicates a short position. The red lines show the support levels, and the green line indicates the resistance levels. These levels can be used to enter and exit trades.
Strategy: SELL, stop loss at 0.9425, take profit at 0.9450.
Resistance levels: 0.9450, 0.9485, and 0.9540
Support levels: 0.9325, 0.9280, and 0.9255.