 English
  Русский
 Bahasa Indonesia
 Bahasa Malay
 ไทย
ไทย Español
 Deutsch
 Български
 Français
 Tiếng Việt
 中文
中文 বাংলা
বাংলা हिन्दी
 Čeština
 Українська
 Română

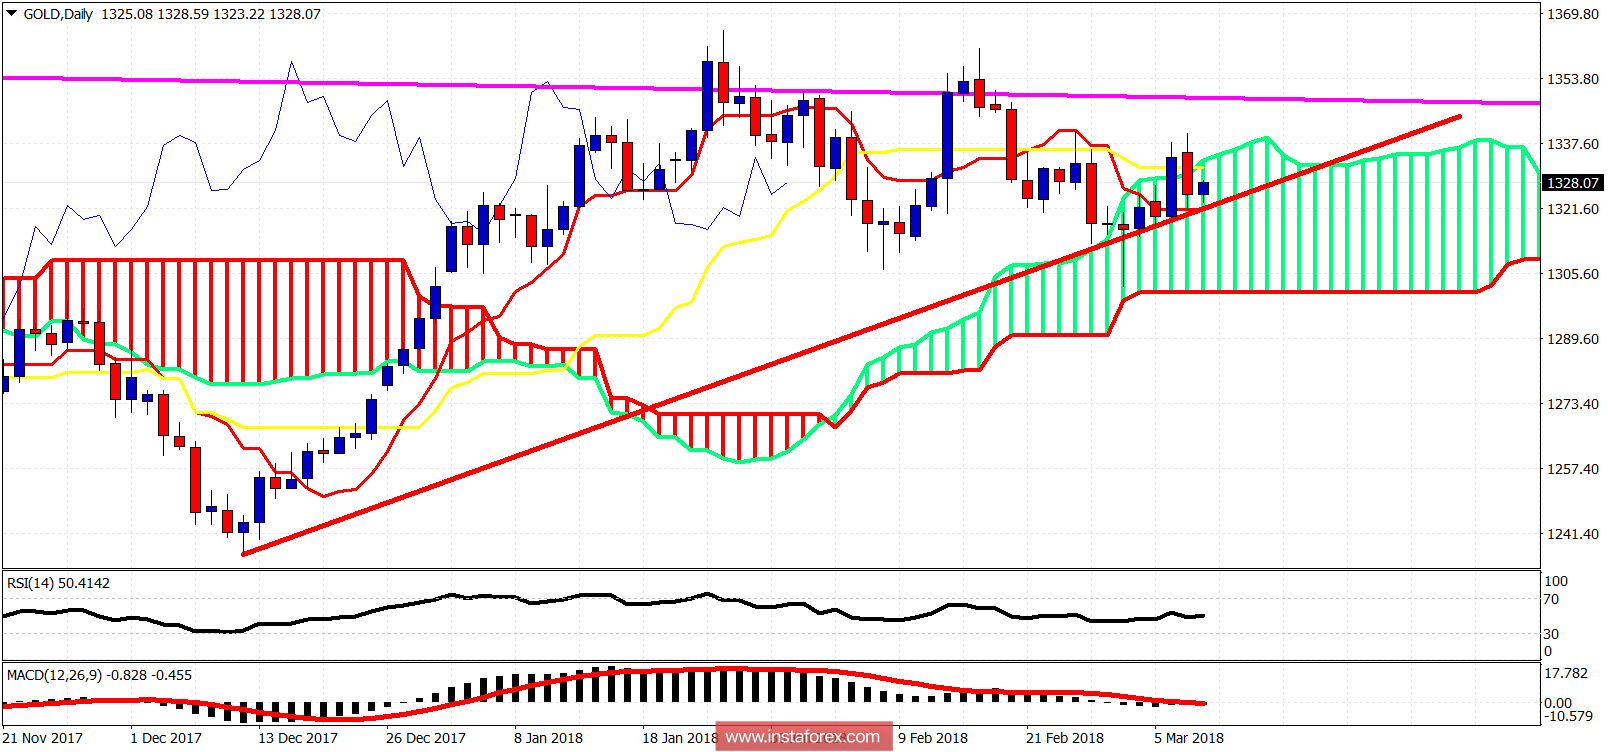
Gold price is making higher highs and higher lows in the 4-hour chart and is breaking above the Kumo. Trend is turning bullish. Medium-term trend is neutral as price remains inside the Daily Kumo and still inside the $1,350-$1,310 trading range.

Red line - short-term support
Gold price is trading inside the Kumo in the Daily chart. The low at $1,302 so far is the most important support level and as long as price is above it, I will be expecting the short-term uptrend to continue and eventually break above the double top for new highs. We also find support at $1,320. Break below it and we will test $1,300. Resistance is at $1,340. Break it and most probably we break the double top.