 English
  Русский
 Bahasa Indonesia
 Bahasa Malay
 ไทย
ไทย Español
 Deutsch
 Български
 Français
 Tiếng Việt
 中文
中文 বাংলা
বাংলা हिन्दी
 Čeština
 Українська
 Română

GBP/USD remains capped by the key psychological level of 1.3900 across the board and such price action could continue for the rest of the week. A break above March 6th highs should expose the resistance level of 1.4078, but a pullback at the current stage remains a possibility in the short term. MACD indicator stays in the negative territory, favoring the bears.
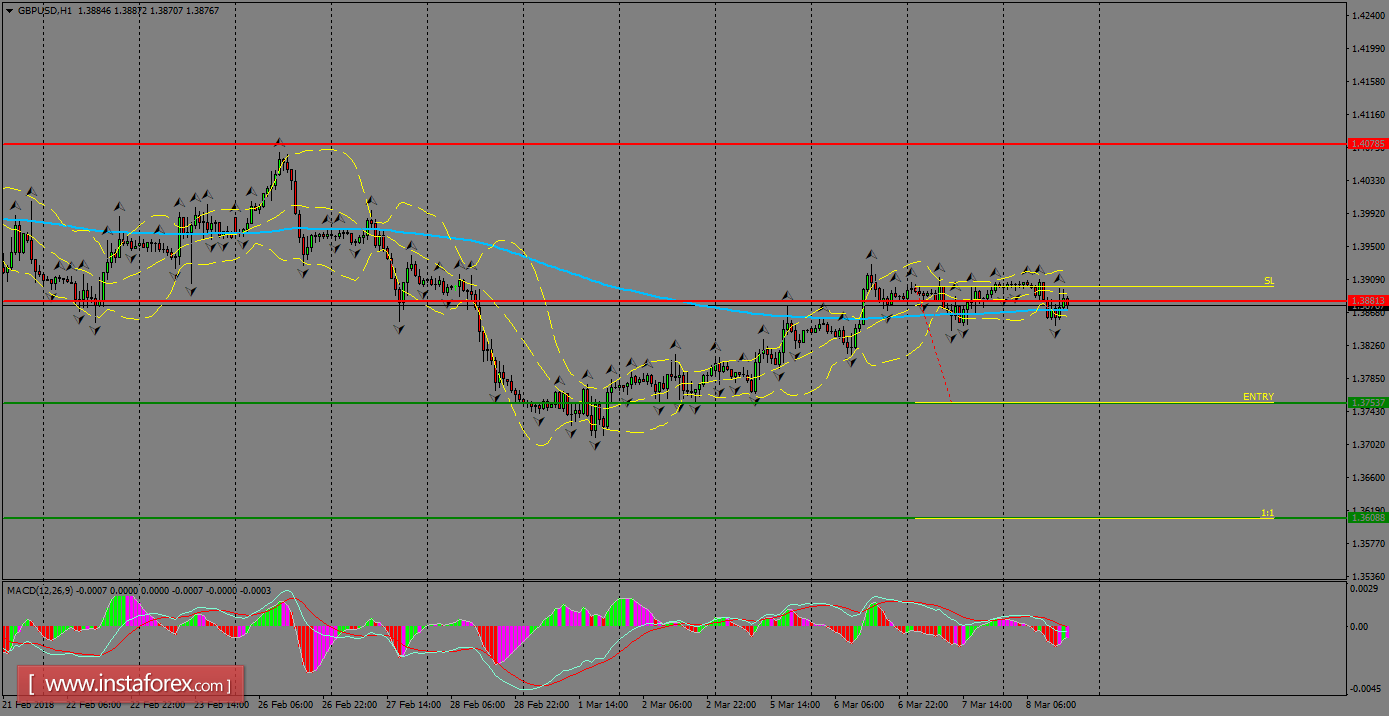
H1 chart's resistance levels: 1.3881 / 1.4078
H1 chart's support levels: 1.3753 / 1.3608
Trading recommendations for today: Based on the H1 chart, place sell (short) orders only if the GBP/USD pair breaks a bearish candlestick; the resistance level is at 1.3753, take profit lies at 1.3608 and stop loss is at 1.3901.