 English
  Русский
 Bahasa Indonesia
 Bahasa Malay
 ไทย
ไทย Español
 Deutsch
 Български
 Français
 Tiếng Việt
 中文
中文 বাংলা
বাংলা हिन्दी
 Čeština
 Українська
 Română

Gold is in a bearish trend. The price is below the Ichimoku cloud on the 4 hour chart and it is challenging the lower boundary of the recent trading range it's been in. I believe it is more probable to see a break below towards $1,280 than the start of a new upward move from current levels.
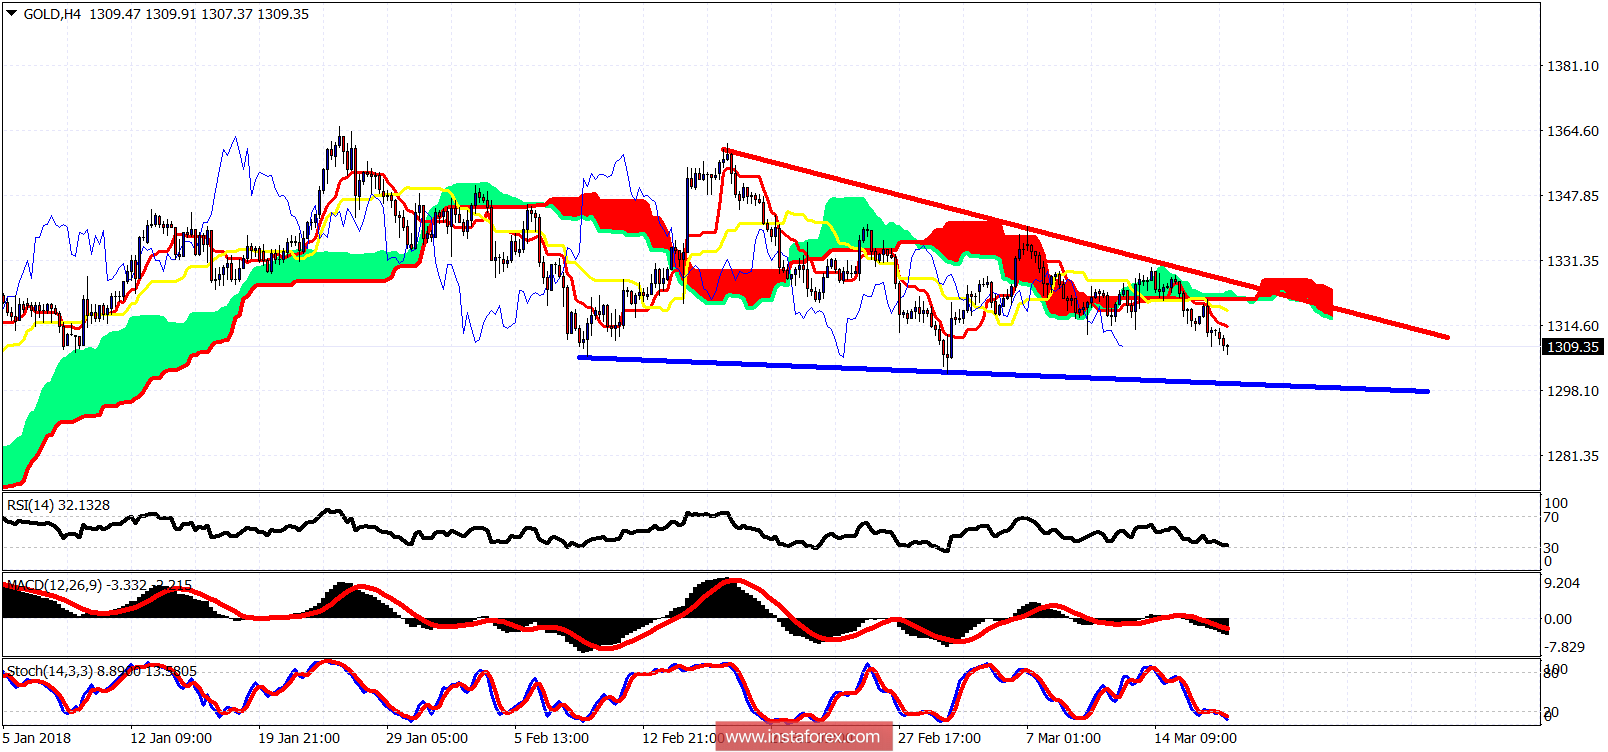
Red line - resistance
Blue line - support
Gold is facing a short-term support at $1,300 and resistance at $1,326. The trend is bearish as the price is below the Kumo and below both the Tenkan- and Kijun-sen indicators. I expect the lower blue line to be challenged and eventually broken to the downside.
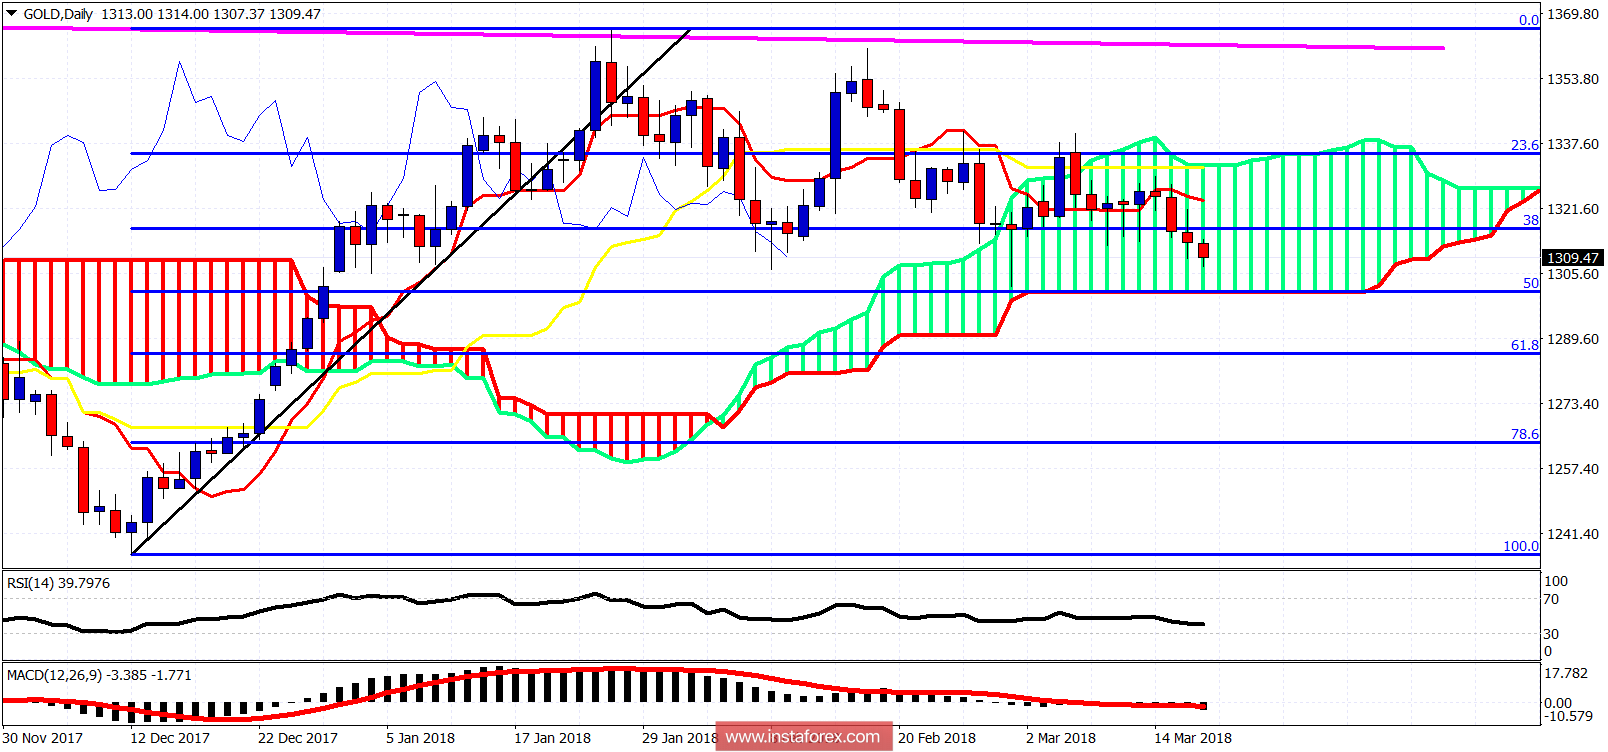
Gold price is in a multiweek sideways corrective move. I believe we are at the final stages of the correction of the rise from $1,236. I expect that we are going to test at least the lower cloud boundary but we are also going towards the 61.8% Fibonacci retracement for a major low before the start of the next leg that will bring the price above $1,400. So, I will be focusing on where the next major low is rather than trading the short-term trend now.