 English
  Русский
 Bahasa Indonesia
 Bahasa Malay
 ไทย
ไทย Español
 Deutsch
 Български
 Français
 Tiếng Việt
 中文
中文 বাংলা
বাংলা हिन्दी
 Čeština
 Українська
 Română

Gold price bounced yesterday but got rejected at the kijun-sen. Short-term trend remains bearish as price remains below the Ichimoku cloud. Medium-term trend remains neutral as the daily candles remain inside the Kumo and still inside the $1,350-$1,300 trading range.
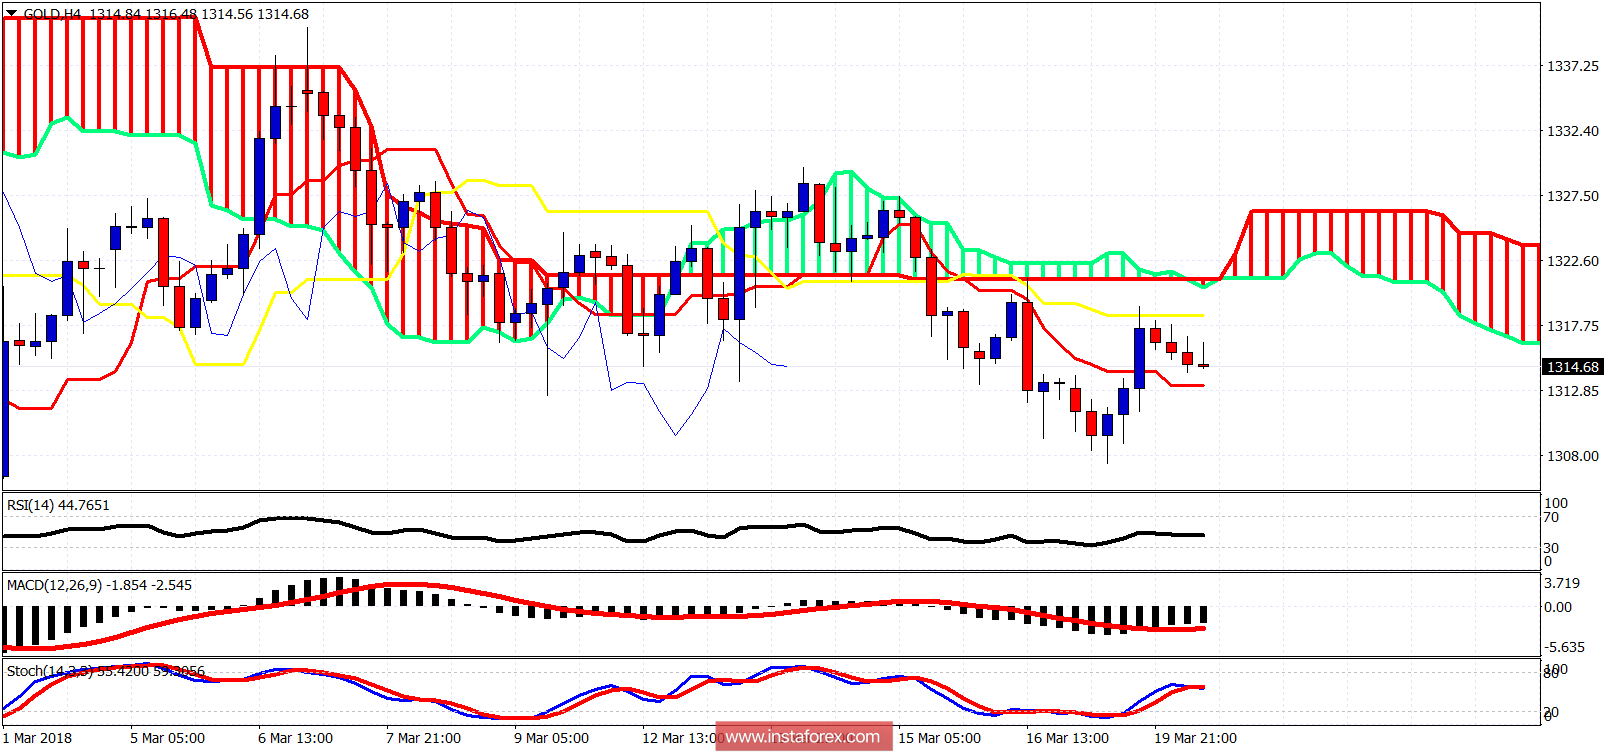
Short-term support is at $1,313 where the 4-hour tankan-sen is found. Resistance is at $1,318.50 (kijun-sen) and at $1,321.50 (Kumo). Trend remains bearish in the short term. Price continues to mainly move sideways between $1,350-$1,300.
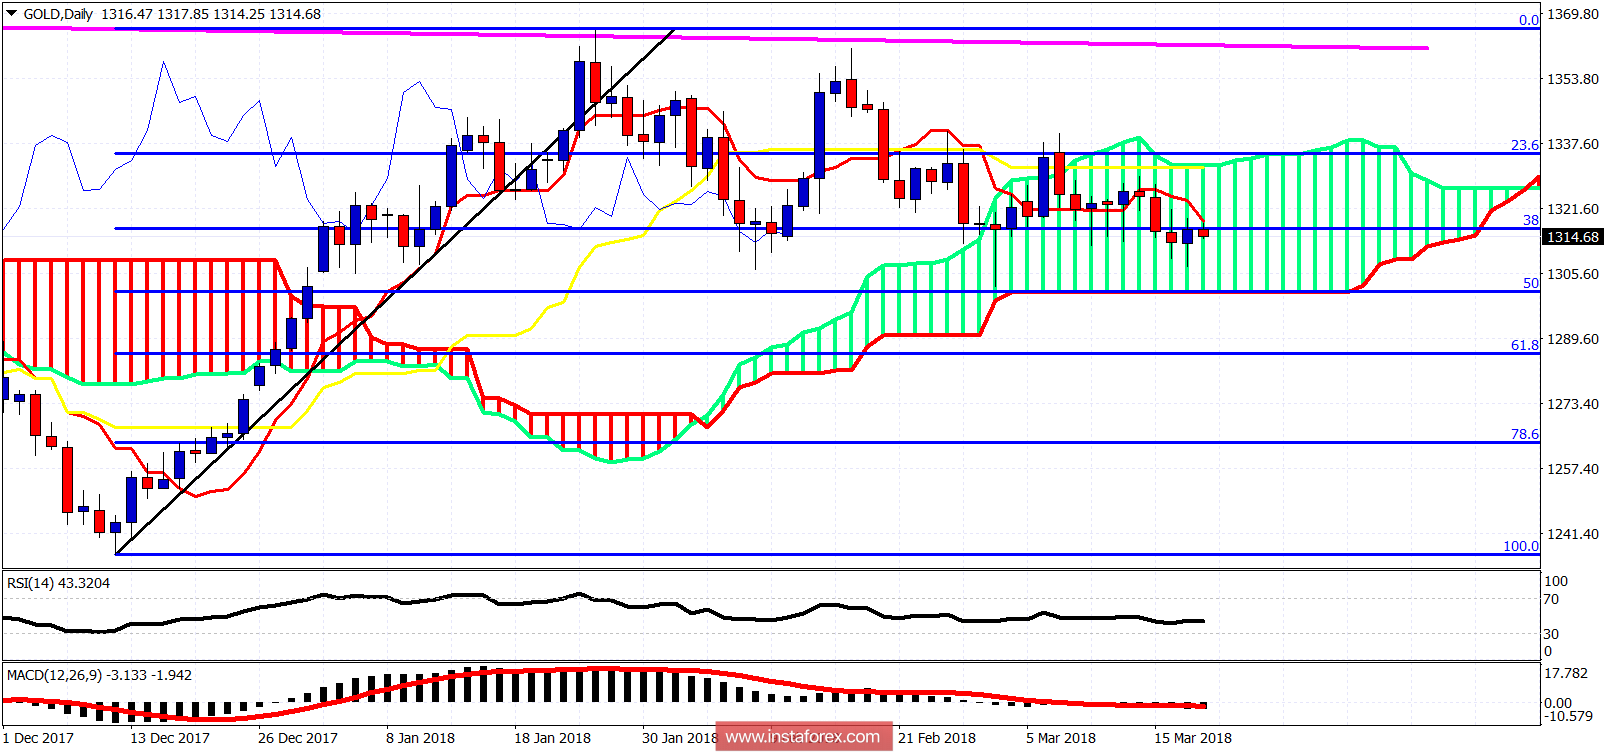
On a daily basis, Gold price is in a neutral trend as price is inside the Kumo. Resistance is at $1,334 and support at $1,300 where we also find the 50% Fibonacci retracement. If the support at $1,300 is breached, we should expect at least a move lower towards the 61.8% Fibonacci retracement. On the other hand, in case the resistance at $1,334 is broken, we could see a test of the long-term resistance at $1,350.