English
  Русский
 Bahasa Indonesia
 Bahasa Malay
 ไทย
ไทย Español
 Deutsch
 Български
 Français
 Tiếng Việt
 中文
中文 বাংলা
বাংলা हिन्दी
 Čeština
 Українська
 Română

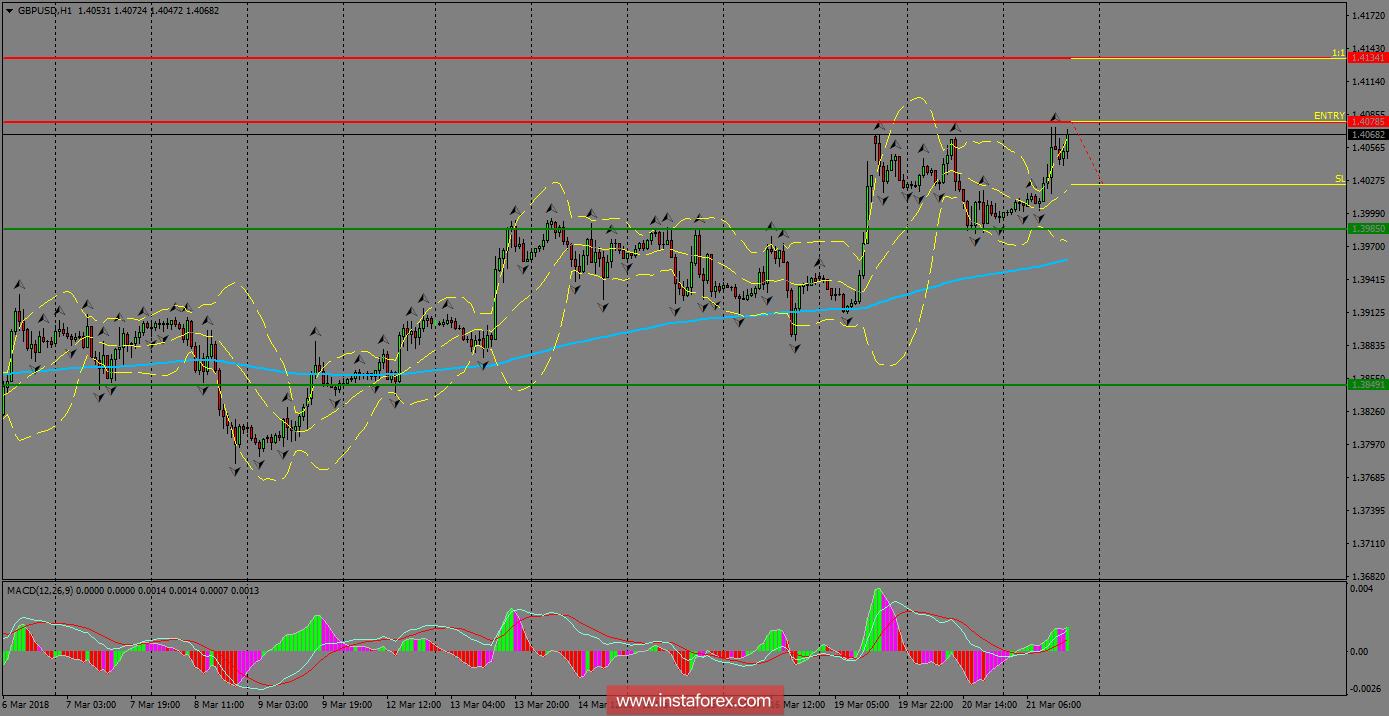
The pair is off from March 19th highs following a momentum gained during the announcement of a deal reached to avoid a "hard Brexit". The price action is now looking to break below 1.3988 in order to re-test the 200 SMA on H1 chart, which is currently providing dynamic support across the board. Such moving average is ahead of the support level at 1.3849.
H1 chart's resistance levels: 1.3988 / 1.4078
H1 chart's support levels: 1.3849 / 1.3753