 English
  Русский
 Bahasa Indonesia
 Bahasa Malay
 ไทย
ไทย Español
 Deutsch
 Български
 Français
 Tiếng Việt
 中文
中文 বাংলা
বাংলা हिन्दी
 Čeština
 Українська
 Română

Gold price remains inside the $1,350-$1,300 trading range. Price has once again broken above the short-term Ichimoku cloud. Medium-term trend remains neutral as price has not made any important break of resistance or support yet.
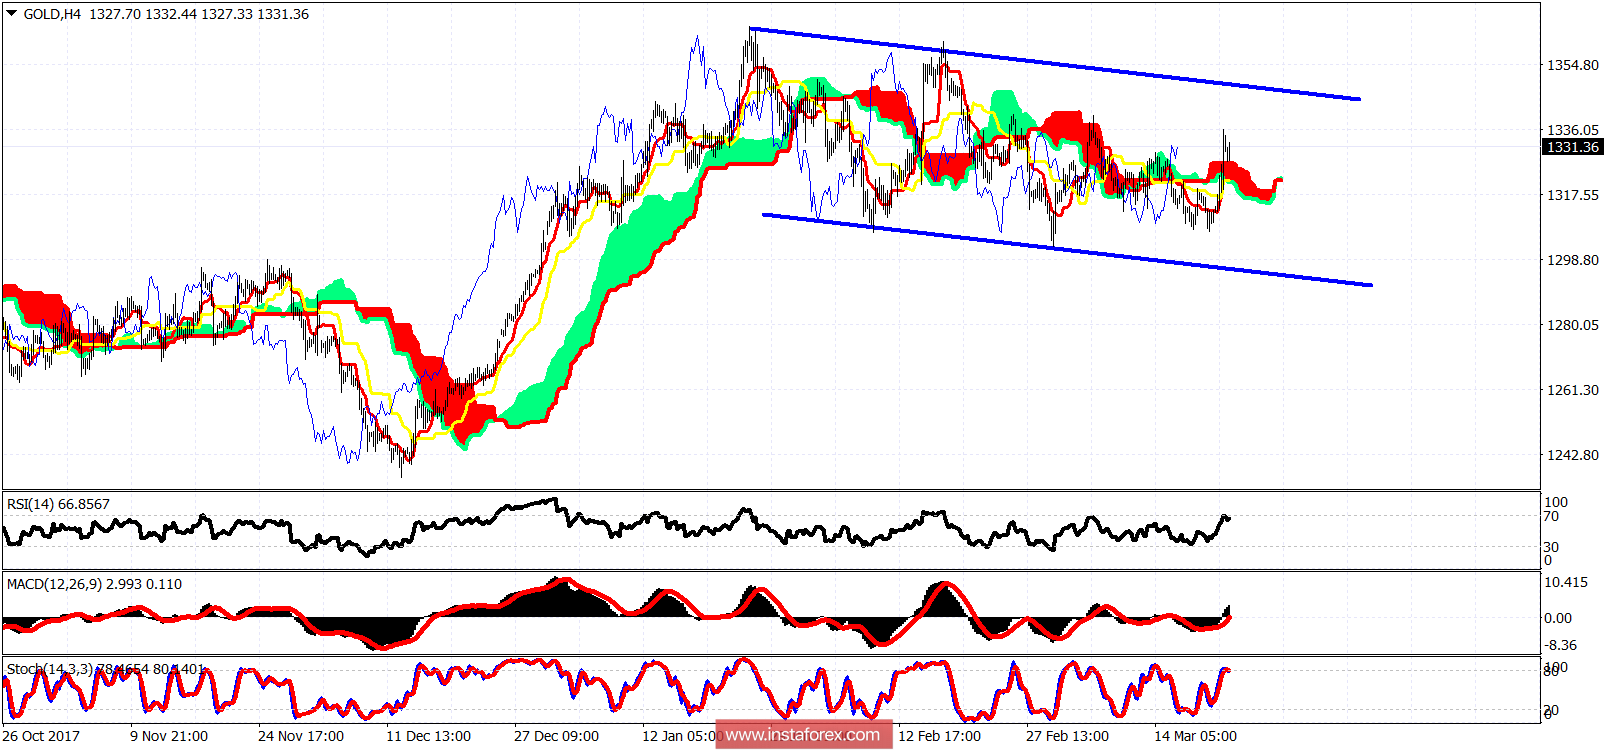
Blue lines - sideways channel
Gold price has short-term support at $1,321 and resistance at $1,349. Bulls want to see price break above the blue trading range in order for a move towards $1,400 to have started. Bears on the other hand need to see price break back below the Ichimoku cloud in the 4-hour chart and eventually break $1,300 for a move at least towards $1,280.
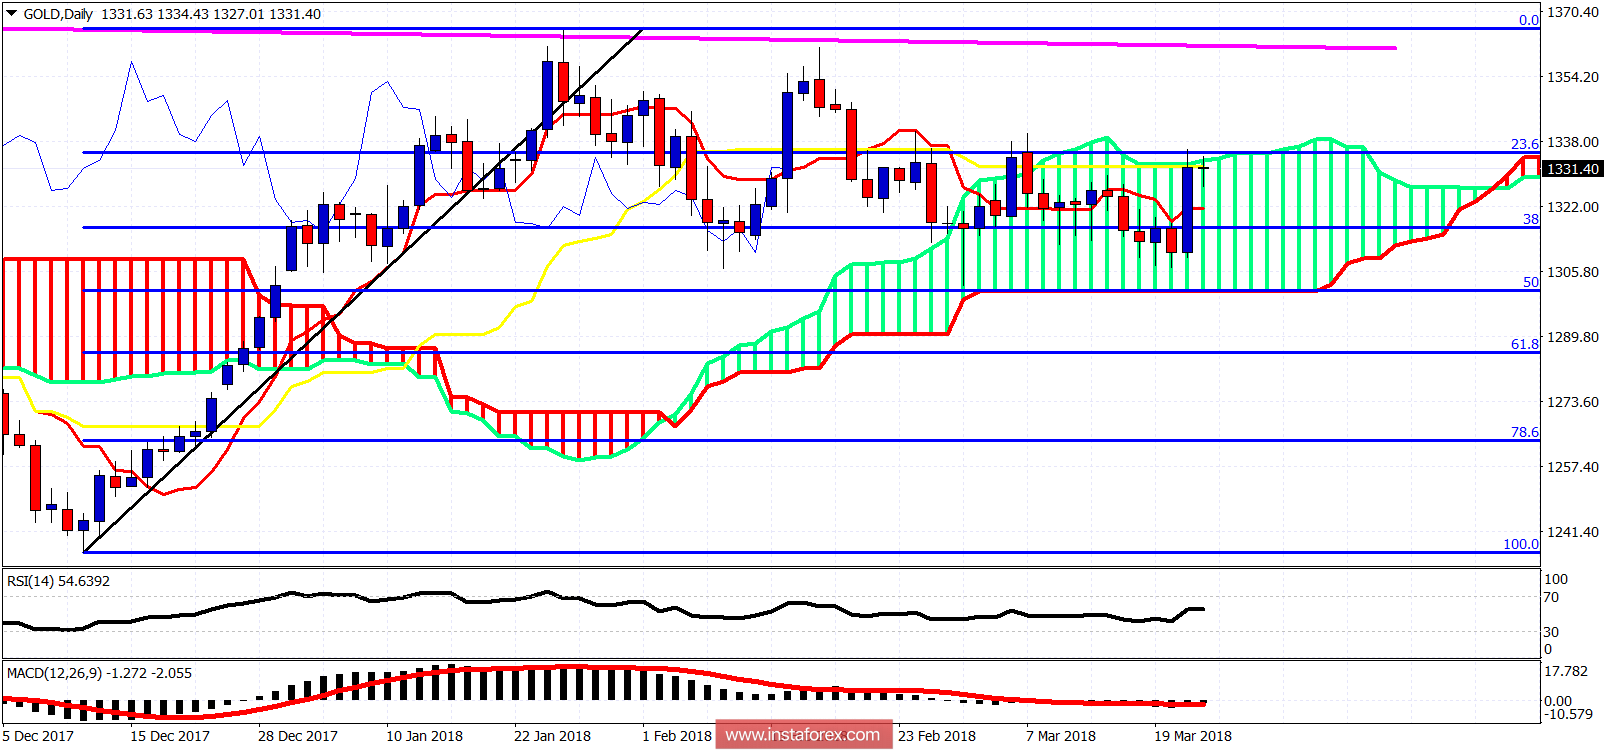
On a daily basis Gold price has reached the upper Kumo boundary which is resistance. A rejection here will push price back towards the 1,300 area. A break and daily close above $1,339 will open the way for the break of the long-term resistance at $1,350.