 English
  Русский
 Bahasa Indonesia
 Bahasa Malay
 ไทย
ไทย Español
 Deutsch
 Български
 Français
 Tiếng Việt
 中文
中文 বাংলা
বাংলা हिन्दी
 Čeština
 Українська
 Română

USD/JPY is in a bearish trend. Price is making lower lows and lower highs. Price is breaking down below a tight trading range its been in. Price is expected to move lower towards 104.
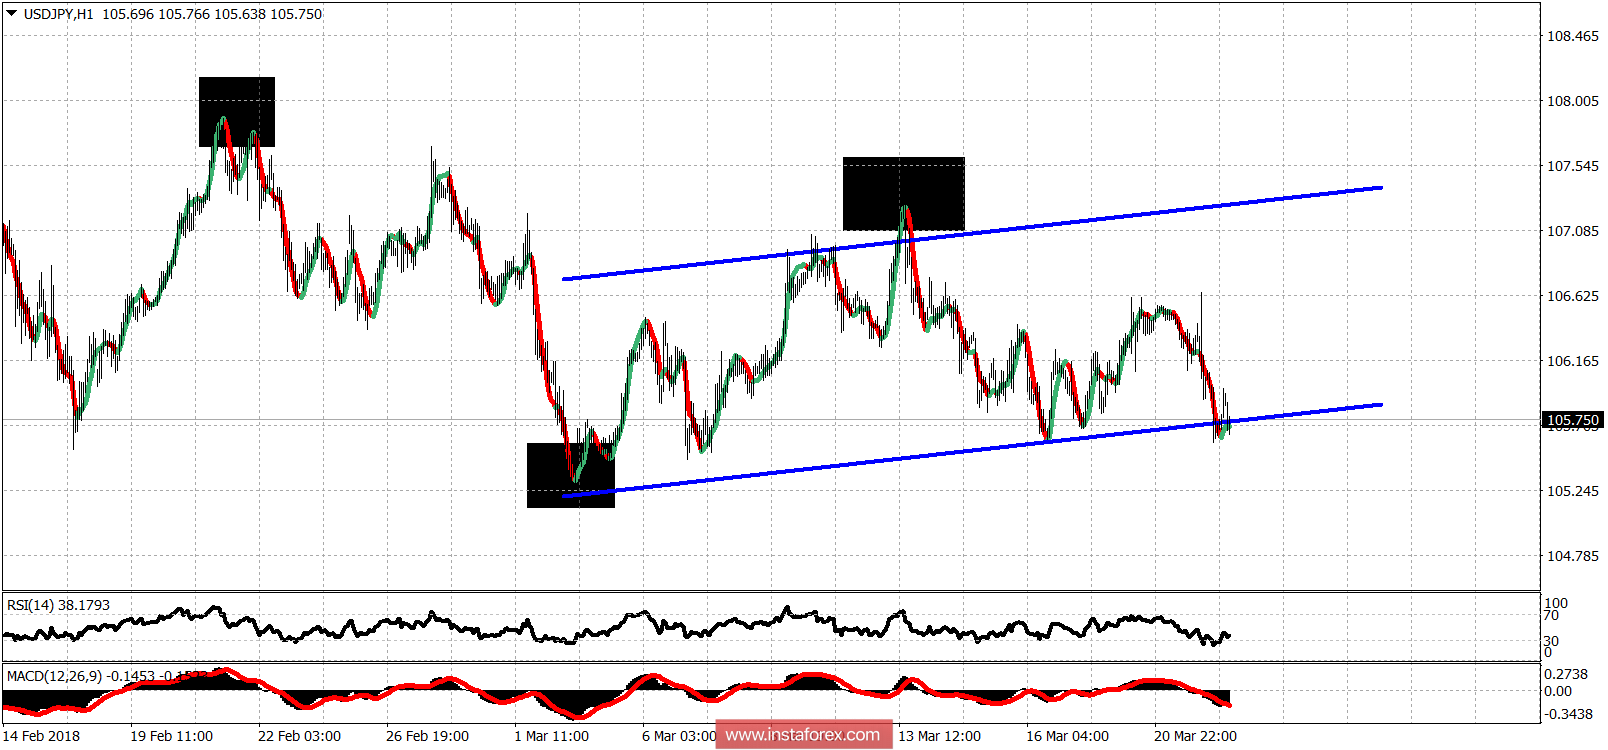
Blue lines - trading range
Black rectangles - lower highs lower lows
Short-term support is at the 105.30-105.40 area. Price is breaking below the trading range and is expected to test the 105.30 support. A break below this level will open the way for a move below 105 towards 104.50. Resistance is at 106.60 and bulls need to retake this level in order to have hopes of a bigger bounce.
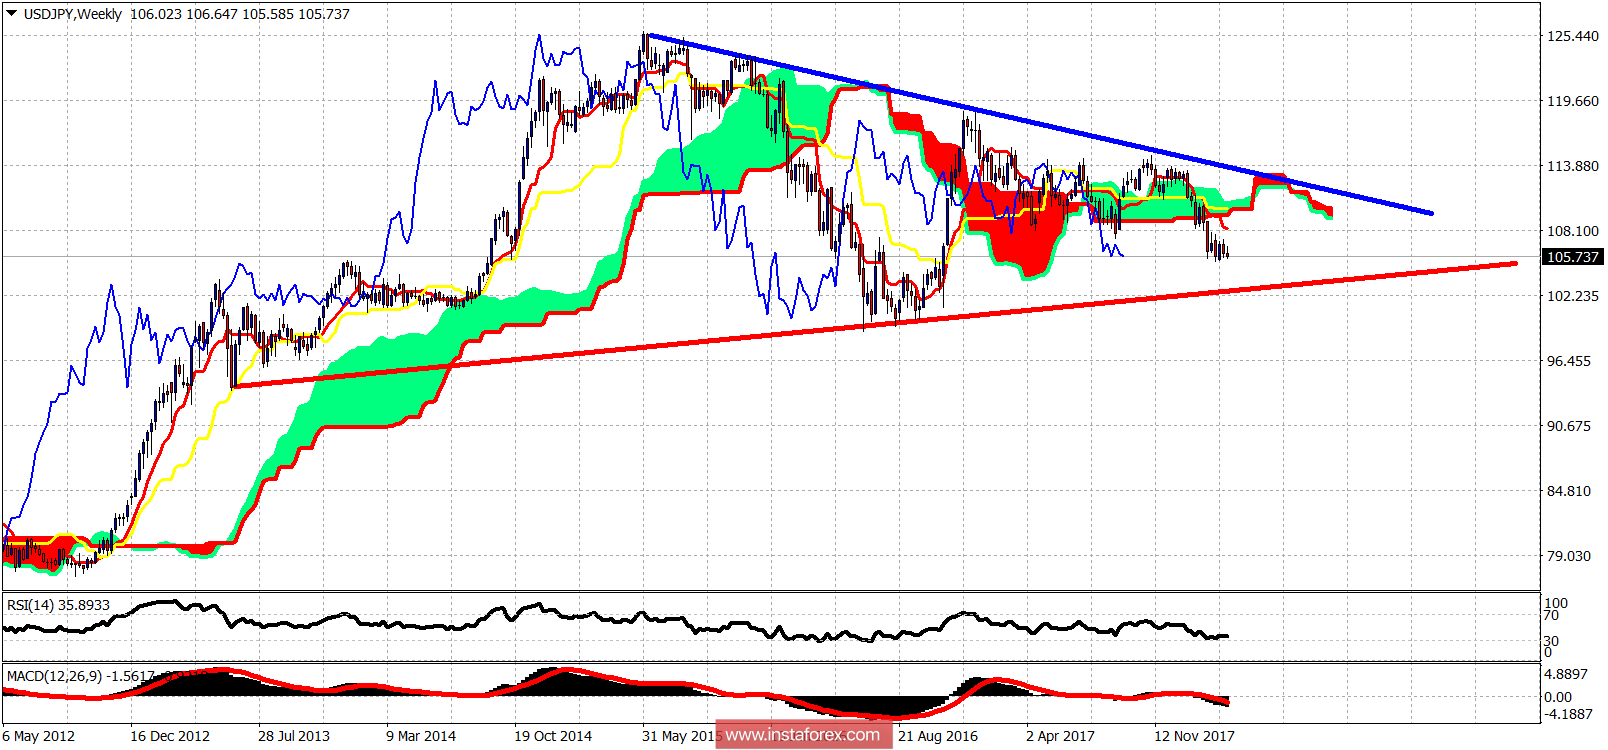
Red line - long-term support
Blue line - long-term resistance
I expect USD/JPY to move towards the long-term red trend line support. This support is now at 103. The blue resistance trend line is at 112.70-113. For a long-term trend reversal to bullish, bulls will need to break above the blue trend line resistance.