 English
  Русский
 Bahasa Indonesia
 Bahasa Malay
 ไทย
ไทย Español
 Deutsch
 Български
 Français
 Tiếng Việt
 中文
中文 বাংলা
বাংলা हिन्दी
 Čeština
 Українська
 Română

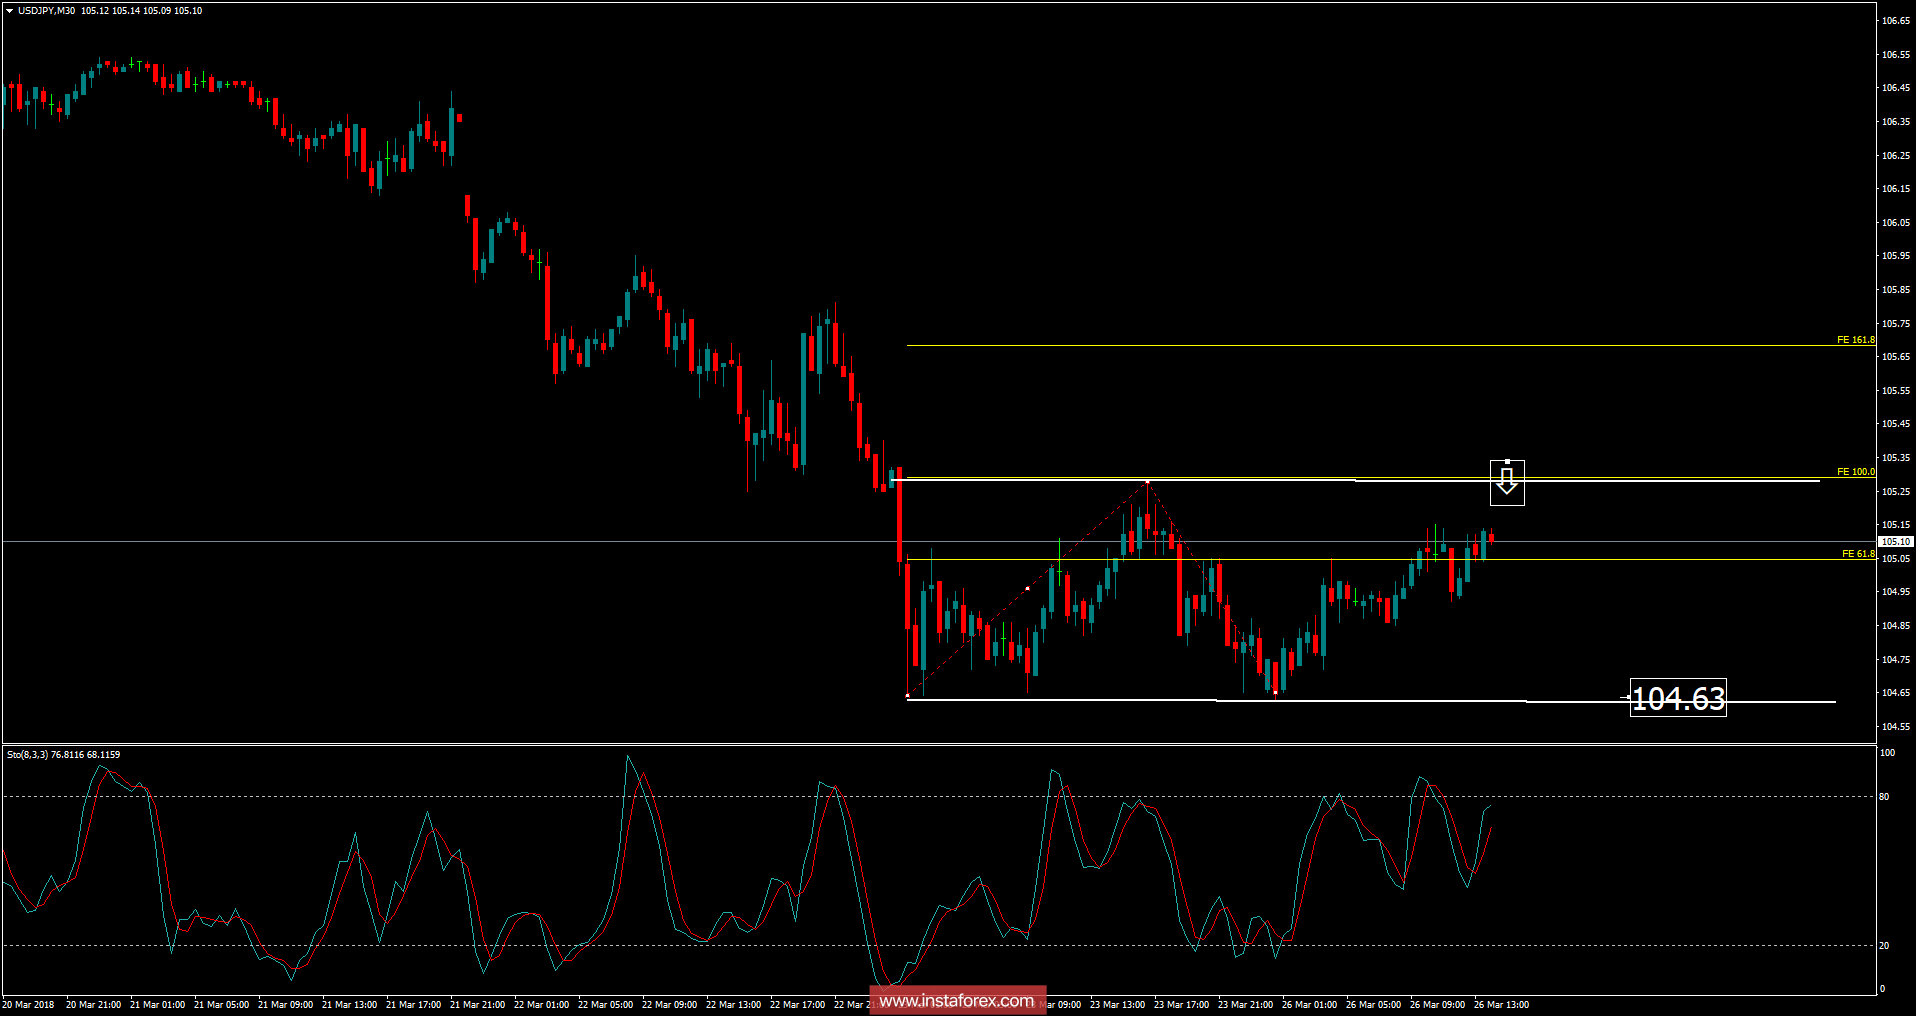
Recently, the USD/JPY has been trading sideways at the price of 105.10. According to the 30M timeframe, I found that price is trading near the Fibonacci expansion 100%, which is sign that buying looks risky. I also found an overbought condition on the stochastic oscillator, which is another sign of weakness. My advice is to watch for potential selling opportunities. The downward target is set at the price of 104.63.
Resistance levels:
R1: 105.20
R2: 105.68
R3: 105.96
Support levels:
S1: 104.43
S2: 104.15
S3: 103.66
Trading recommendations for today: watch for potential selling opportunities.