 English
  Русский
 Bahasa Indonesia
 Bahasa Malay
 ไทย
ไทย Español
 Deutsch
 Български
 Français
 Tiếng Việt
 中文
中文 বাংলা
বাংলা हिन्दी
 Čeština
 Українська
 Română

USDX recovered from Tuesday's lows and it's reaching the 200 SMA at the H1 chart, where it can find dynamic resistance in order to resume the bearish structure in the short-term. If that happens, then we might expect a lower continuation towards the support zone of 87.88, while a break above the moving average should expose the resistance level of 90.63.
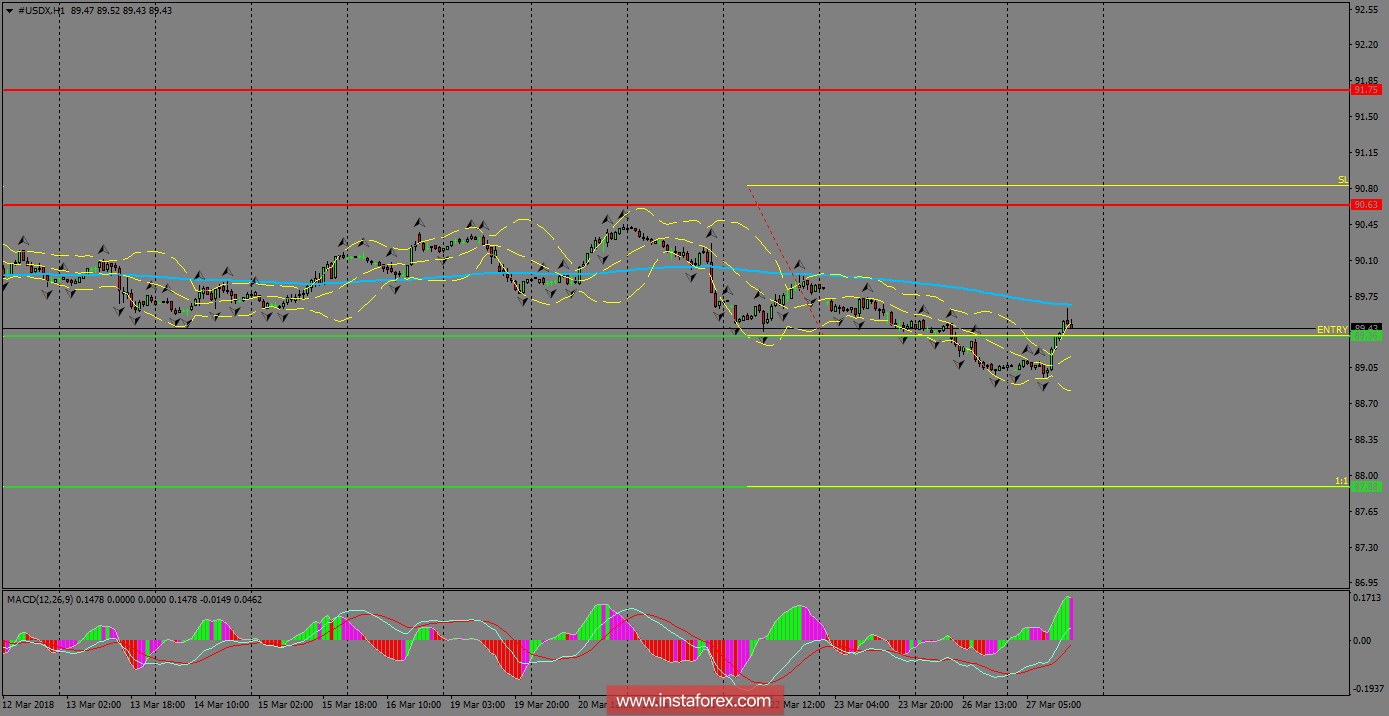
H1 chart's resistance levels: 90.63 / 91.75
H1 chart's support levels: 89.36 / 87.88
Trading recommendations for today: Based on the H1 chart, place sell (short) orders only if the USD Index breaks with a bearish candlestick; the support level is at 89.36, take profit is at 87.88 and stop loss is at 90.81.