 English
  Русский
 Bahasa Indonesia
 Bahasa Malay
 ไทย
ไทย Español
 Deutsch
 Български
 Français
 Tiếng Việt
 中文
中文 বাংলা
বাংলা हिन्दी
 Čeština
 Українська
 Română

Gold price as expected has pulled back and got rejected at the resistance area. As explained in our previous analysis, Gold price was expected to move lower towards $1,320-30 area. I believe the pull back has started.
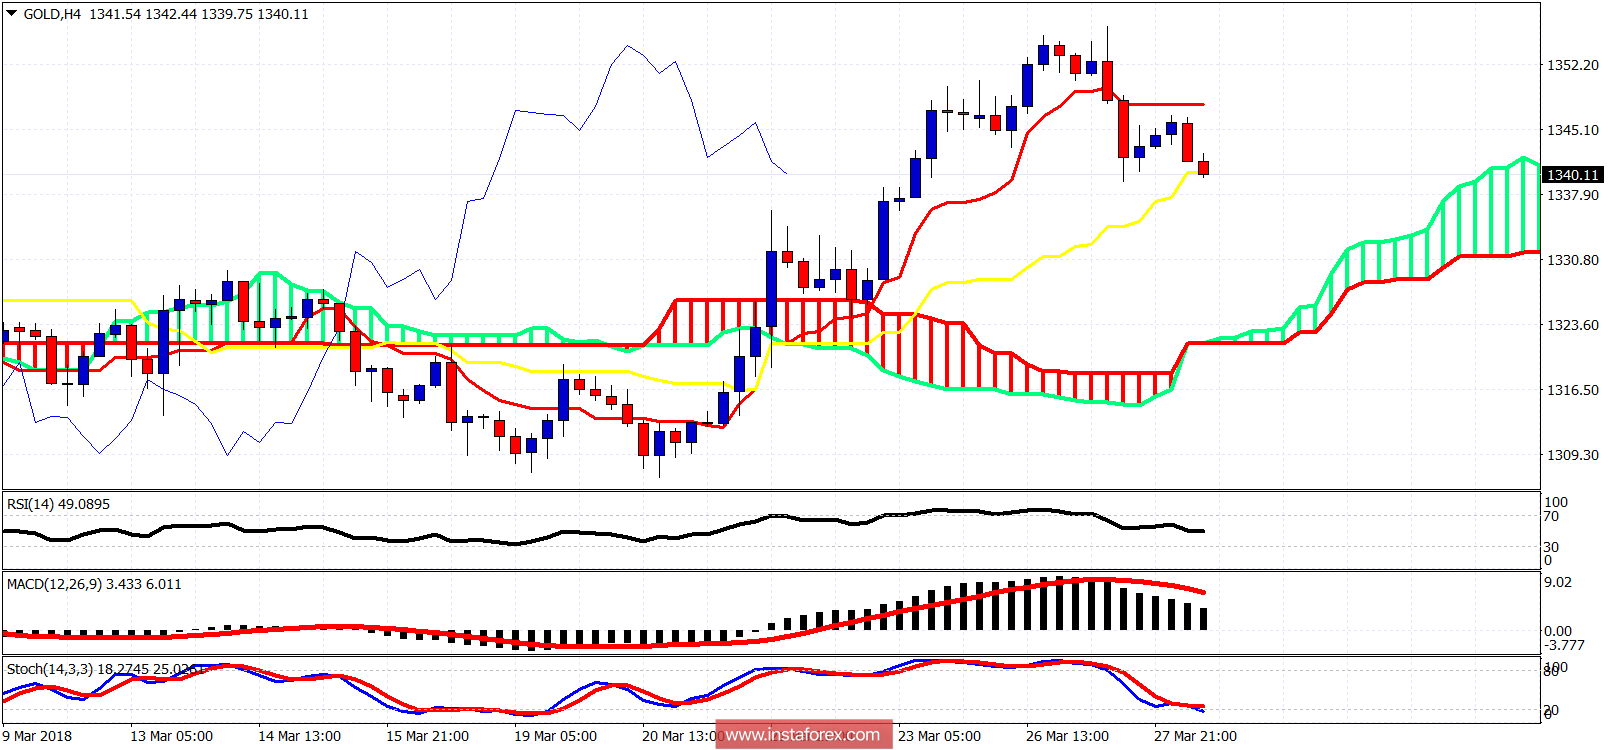
Gold price is making lower lows and lower highs and is breaking below the 4-hour kijun-sen (yellow line indicator). This implies more weakness ahead and a move towards the cloud support around $1,320.
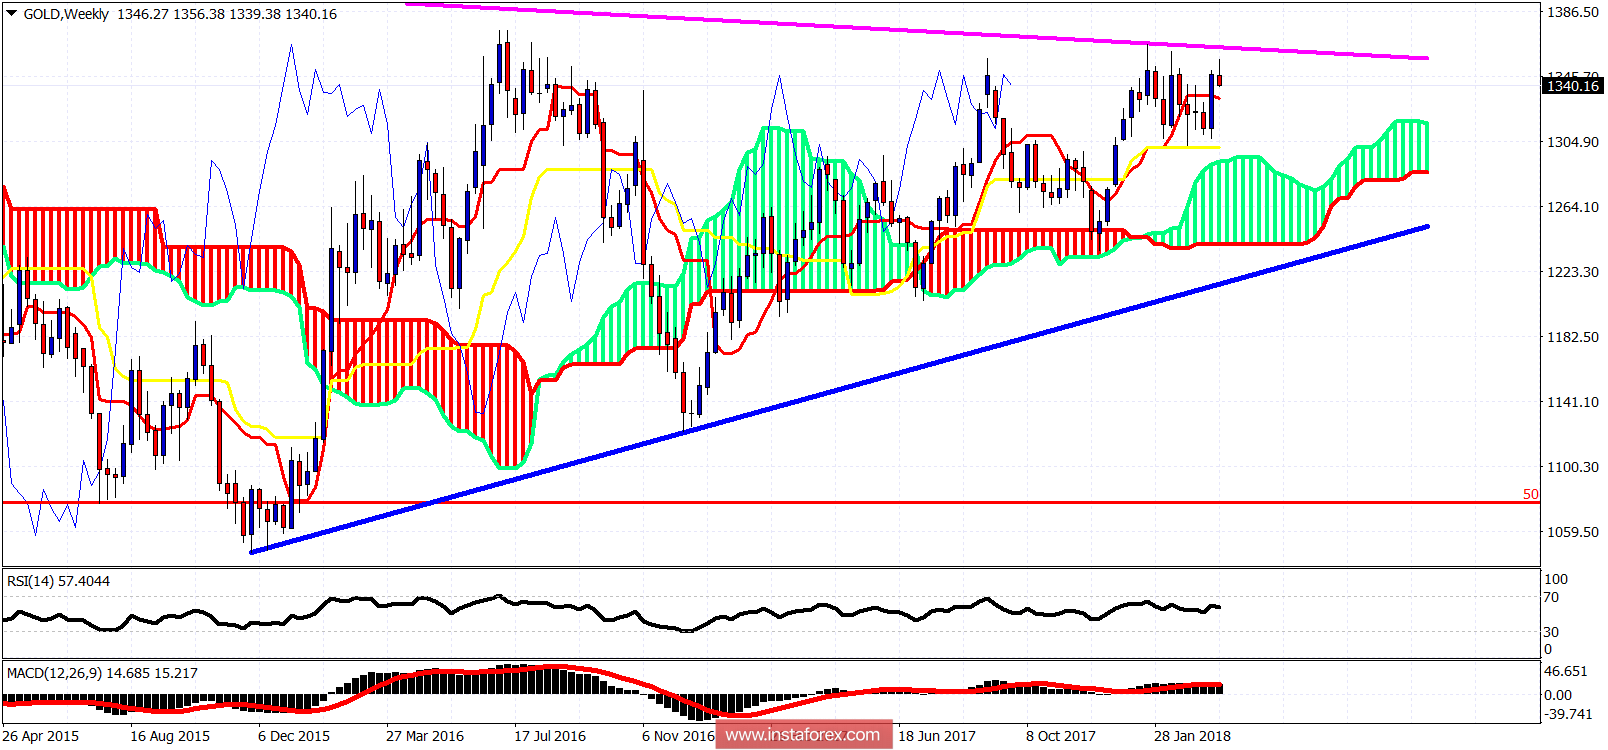
Magenta line - long-term resistance
Blue line - long-term support
On a weekly basis we remain above both the tankan- and kijun-sen indicators. Price as expected got rejected at the long-term resistance trend line. Support on a weekly basis is at $1,332 and next at $1,300. I believe the $1,300 support will not be broken. However I believe that we will briefly move below the $1,332 level.