 English
  Русский
 Bahasa Indonesia
 Bahasa Malay
 ไทย
ไทย Español
 Deutsch
 Български
 Français
 Tiếng Việt
 中文
中文 বাংলা
বাংলা हिन्दी
 Čeština
 Українська
 Română

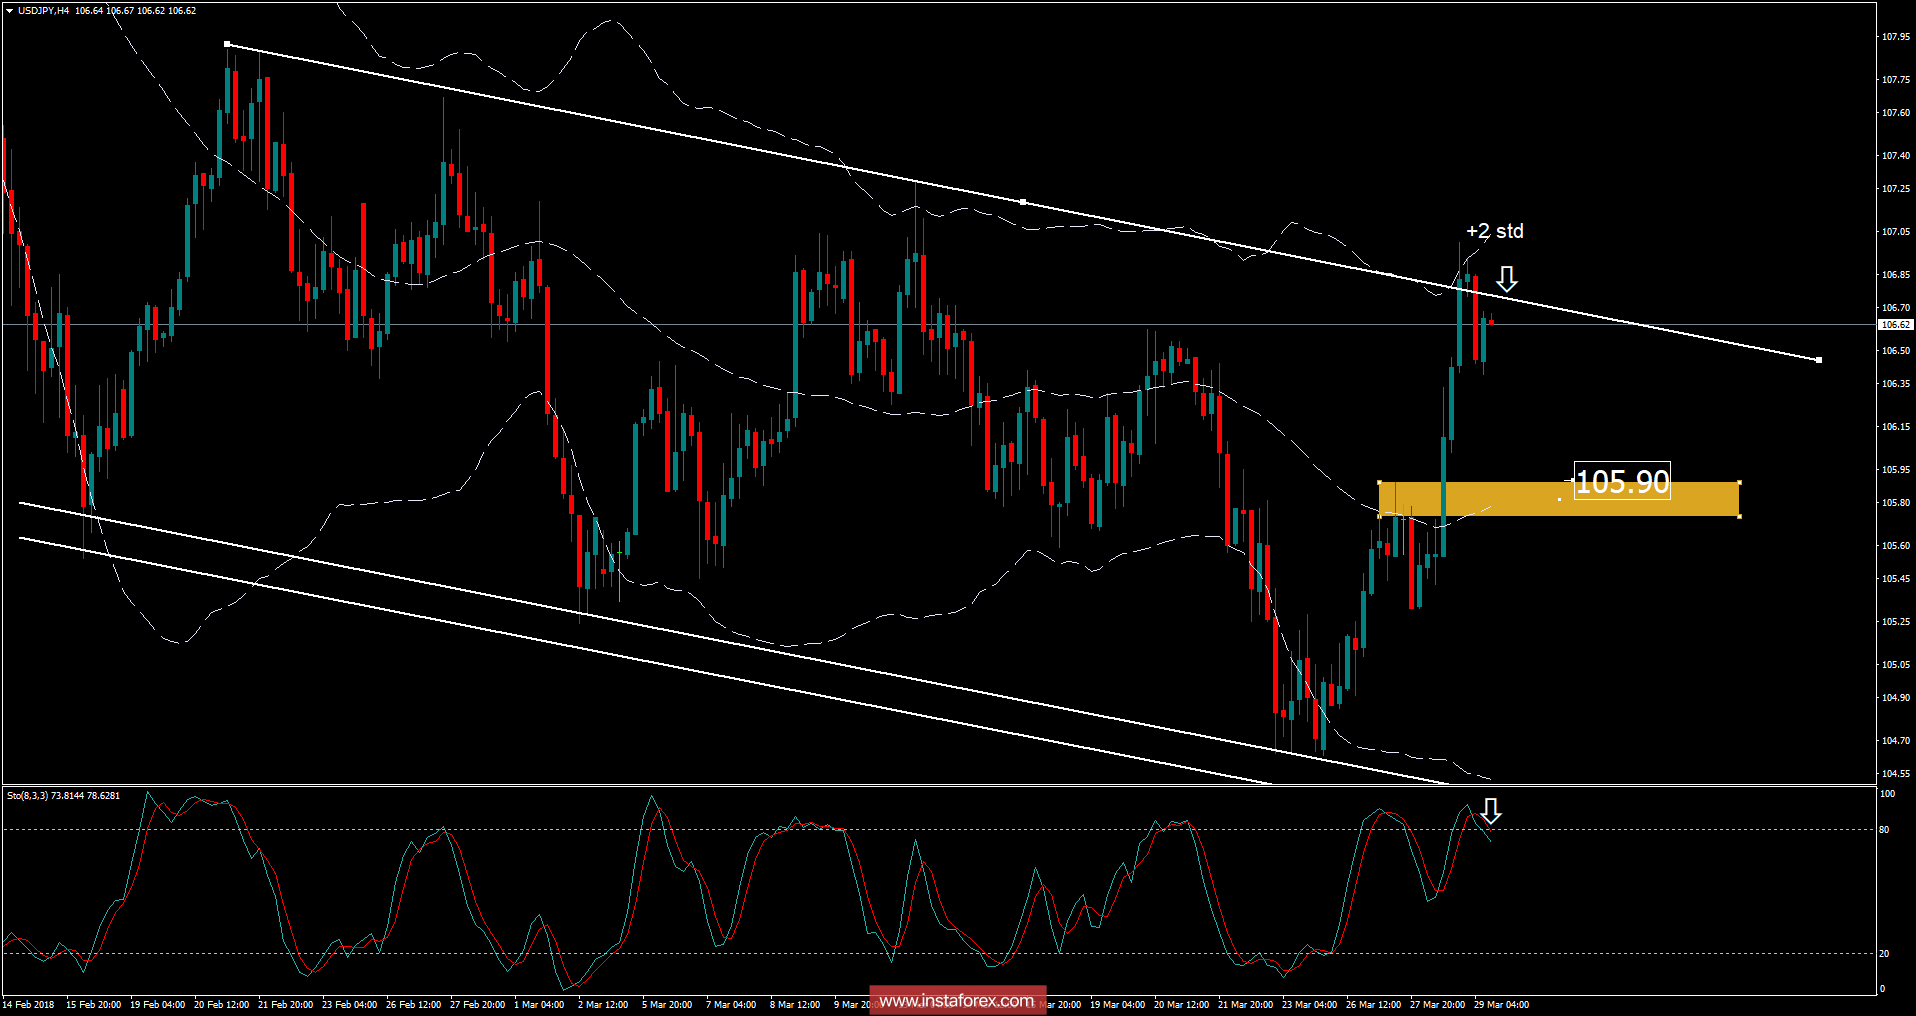
Recently, the USD/JPY pair has been trading upwards. The price tested the level of 107.00. According to the 4H time frame, I found that price rejected from the upper band of the Bolinger band, which is a sign that market is "too long". I also found a rejection of the supply trendline and overbought conditions on the stochastic oscillator, which is another sign of weakness. My advice is to watch for potential selling opportunities. The downward target is set at the price of 105.90.
Resistance levels:
R1: 107.46
R2: 108.08
R3: 109.15
Support levels:
S1: 105.78
S2: 104.70
S3: 104.10
Trading recommendations for today: watch for potential selling opportunities.