 English
  Русский
 Bahasa Indonesia
 Bahasa Malay
 ไทย
ไทย Español
 Deutsch
 Български
 Français
 Tiếng Việt
 中文
中文 বাংলা
বাংলা हिन्दी
 Čeština
 Українська
 Română

USDX stays above the 200 SMA at H1 chart and looks forward to reaching the resistance zone of 90.63, where a breakout should open the doors to test the 91.75 level. Such move should strengthen the bullish bias, as the index has been struggling to consolidate a clear trend in the short-term. To the downside, if it manages to break below 89.36, then the next target would be the 87.88 level.
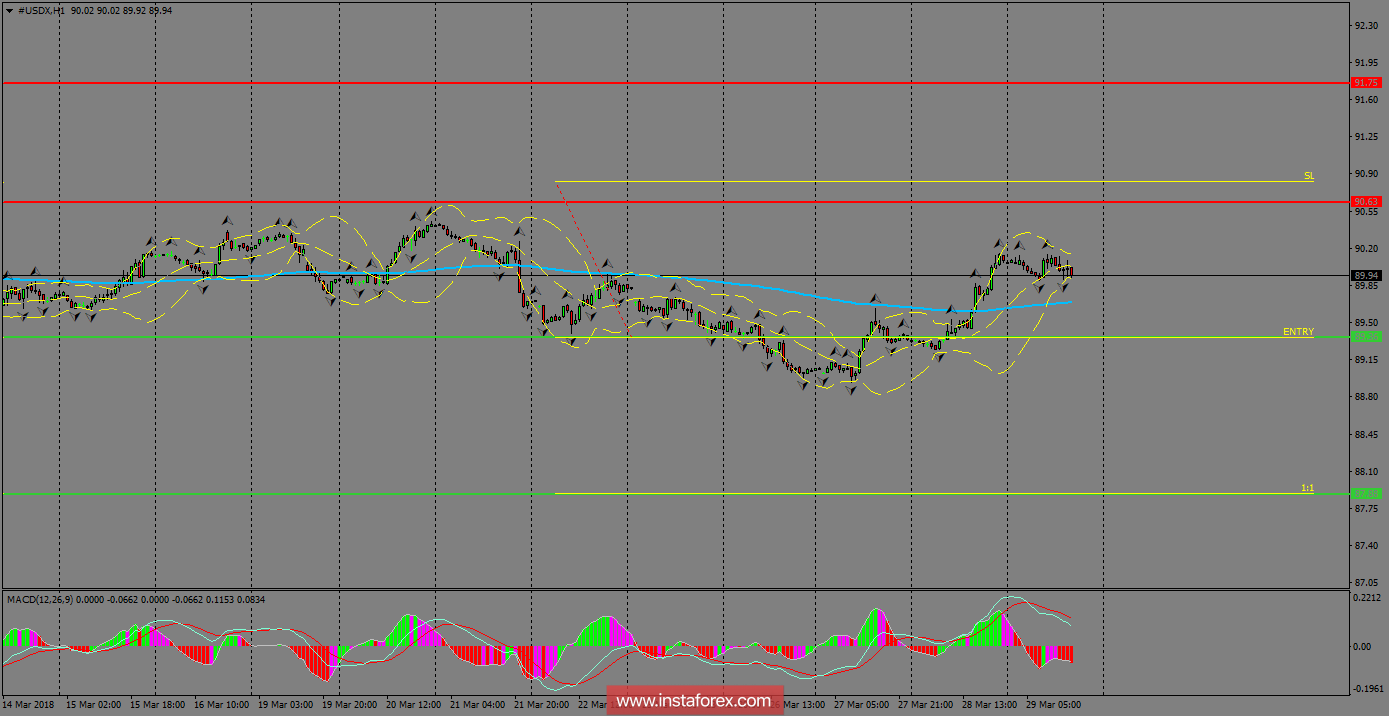
H1 chart's resistance levels: 90.63 / 91.75
H1 chart's support levels: 89.36 / 87.88
Trading recommendations for today: Based on the H1 chart, place sell (short) orders only if the USD Index breaks with a bearish candlestick; the support level is at 89.36, take profit is at 87.88 and stop loss is at 90.81.