 English
  Русский
 Bahasa Indonesia
 Bahasa Malay
 ไทย
ไทย Español
 Deutsch
 Български
 Français
 Tiếng Việt
 中文
中文 বাংলা
বাংলা हिन्दी
 Čeština
 Українська
 Română

The pair had no major action on Friday as the Easter holidays came in. Currently, the price action is consolidating below the 200 SMA at H1 chart and it can plummet to re-test the support zone of 1.3985. However, as long as GBP/USD stays above the 1.40 handle, we can expect further gains to attempt a consolidation above the moving average.
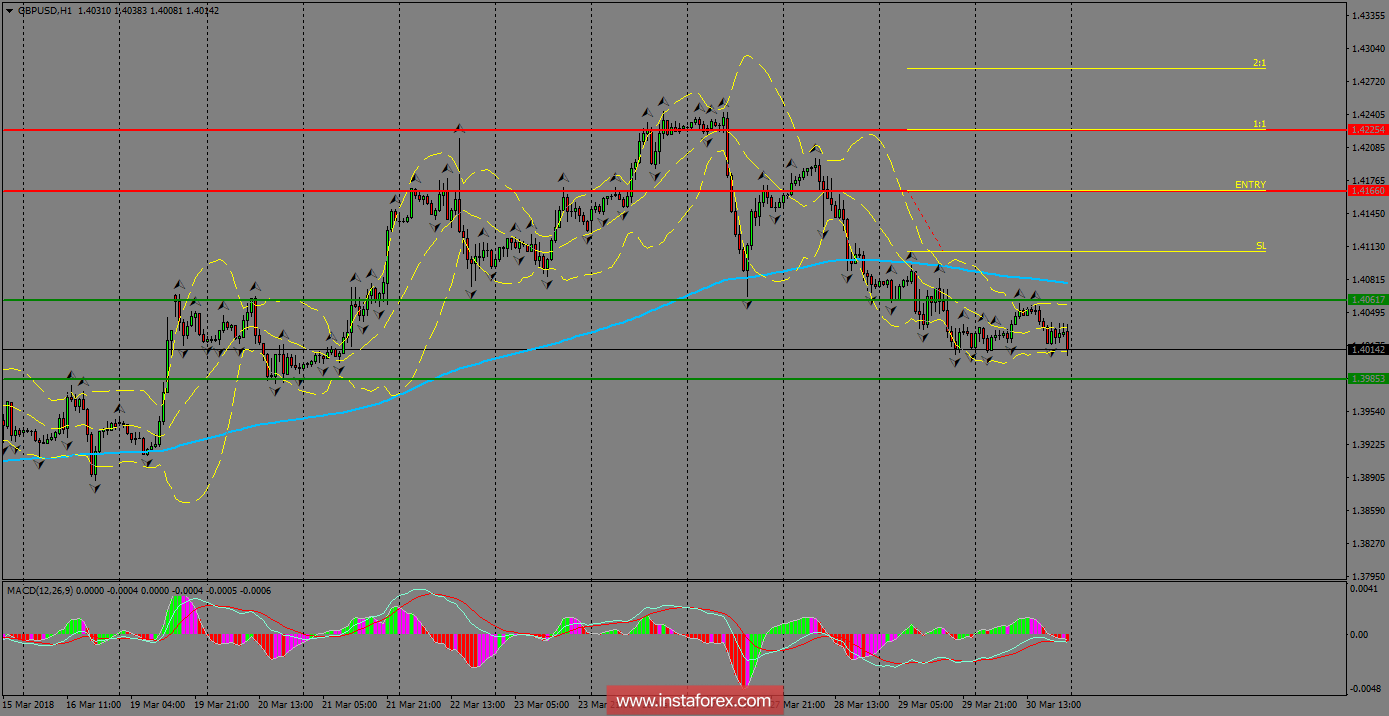
H1 chart's resistance levels: 1.4166 / 1.4225
H1 chart's support levels: 1.4061 / 1.3985
Trading recommendations for today: Based on the H1 chart, buy (long) orders only if the GBP/USD pair breaks a bullish candlestick; the resistance level is at 1.4166, take profit is at 1.4225, and stop loss is at 1.4108.