 English
  Русский
 Bahasa Indonesia
 Bahasa Malay
 ไทย
ไทย Español
 Deutsch
 Български
 Français
 Tiếng Việt
 中文
中文 বাংলা
বাংলা हिन्दी
 Čeština
 Українська
 Română

We're not seeing major actions in the current structure of the index, as it remains above the 200 SMA at the H1 chart and looks forward to reaching the resistance level of 90.63. Should the index break above that area in order to test the next key target at 91.75. To the downside, the support zone of 89.36 could be pierced to strengthen the bearish bias.
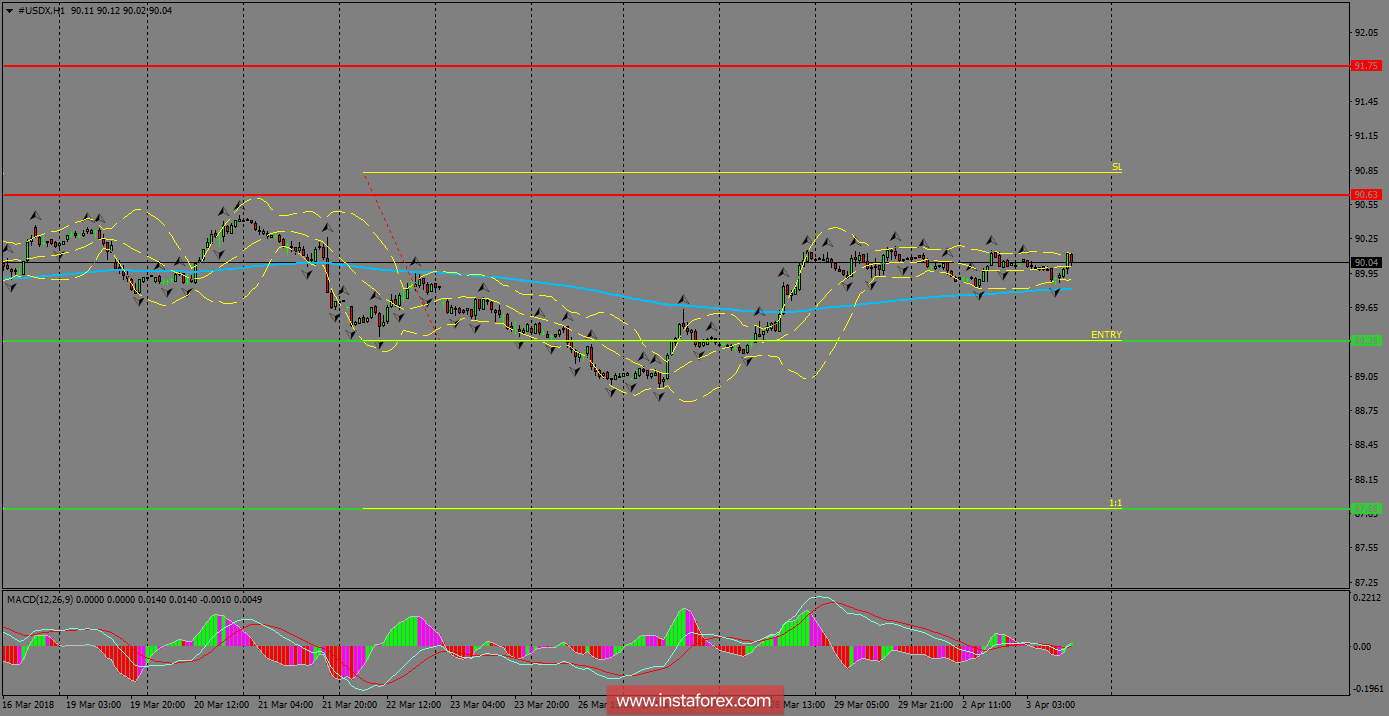
H1 chart's resistance levels: 90.63 / 91.75
H1 chart's support levels: 89.36 / 87.88
Trading recommendations for today: Based on the H1 chart, place sell (short) orders only if the USD Index breaks with a bearish candlestick; the support level is at 89.36, take profit is at 87.88 and stop loss is at 90.81.