 English
  Русский
 Bahasa Indonesia
 Bahasa Malay
 ไทย
ไทย Español
 Deutsch
 Български
 Français
 Tiếng Việt
 中文
中文 বাংলা
বাংলা हिन्दी
 Čeština
 Українська
 Română

GBP/USD had a volatile session during Wednesday as it continues to trade within the 200 SMA range at the H1 chart. The next target to the upside lies at 1.4166, where the sellers are waiting for a short-term pullback. If the pair does a break above such area, the buyers could gain momentum towards the 1.4225 level. MACD indicator stays in the negative territory, favoring to the bears.
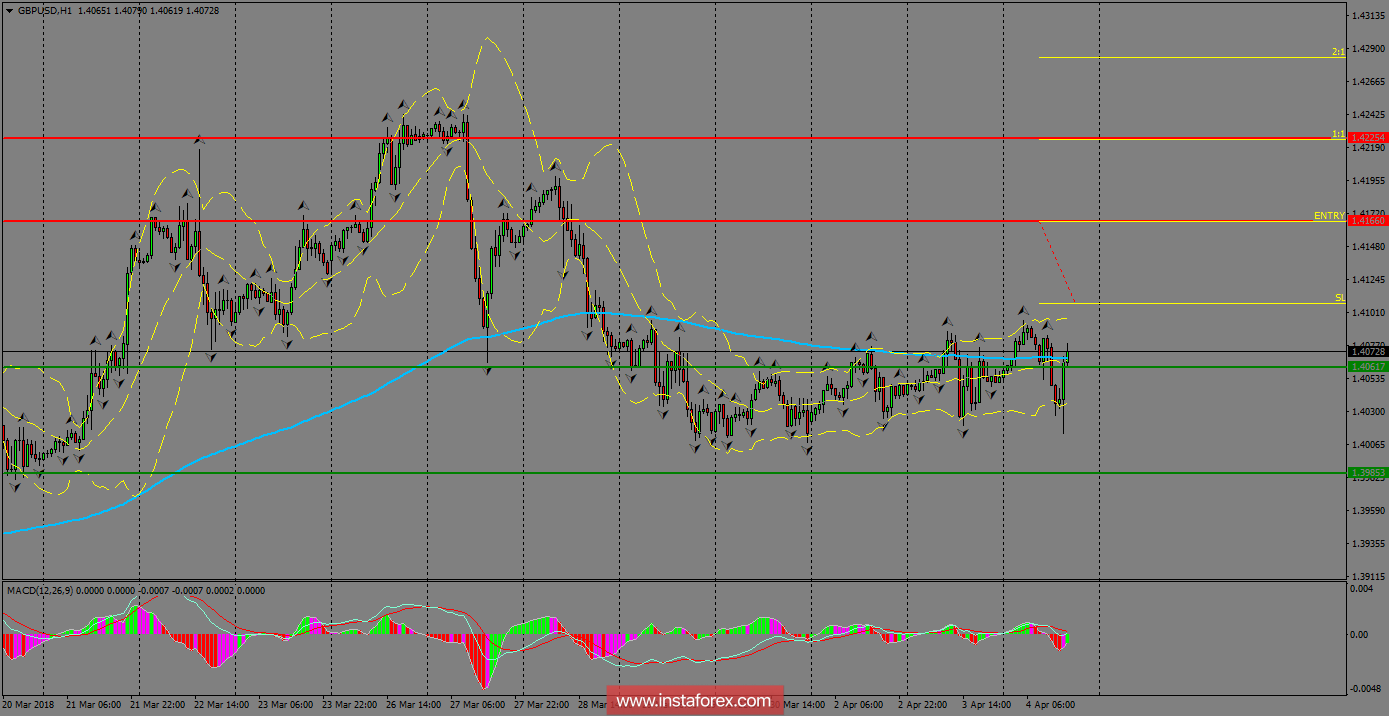
H1 chart's resistance levels: 1.4166 / 1.4225
H1 chart's support levels: 1.4061 / 1.3985
Trading recommendations for today: Based on the H1 chart, buy (long) orders only if the GBP/USD pair breaks a bullish candlestick; the resistance level is at 1.4166, take profit is at 1.4225 and stop loss is at 1.4108.