 English
  Русский
 Bahasa Indonesia
 Bahasa Malay
 ไทย
ไทย Español
 Deutsch
 Български
 Français
 Tiếng Việt
 中文
中文 বাংলা
বাংলা हिन्दी
 Čeština
 Українська
 Română

Gold price has tried to bounce towards $1,350, but only managed to top around $1,348 and reverse back towards $1,330. Price is trading again below the 4 hour Ichimoku cloud and is vulnerable to a deeper pull back towards $1,300.
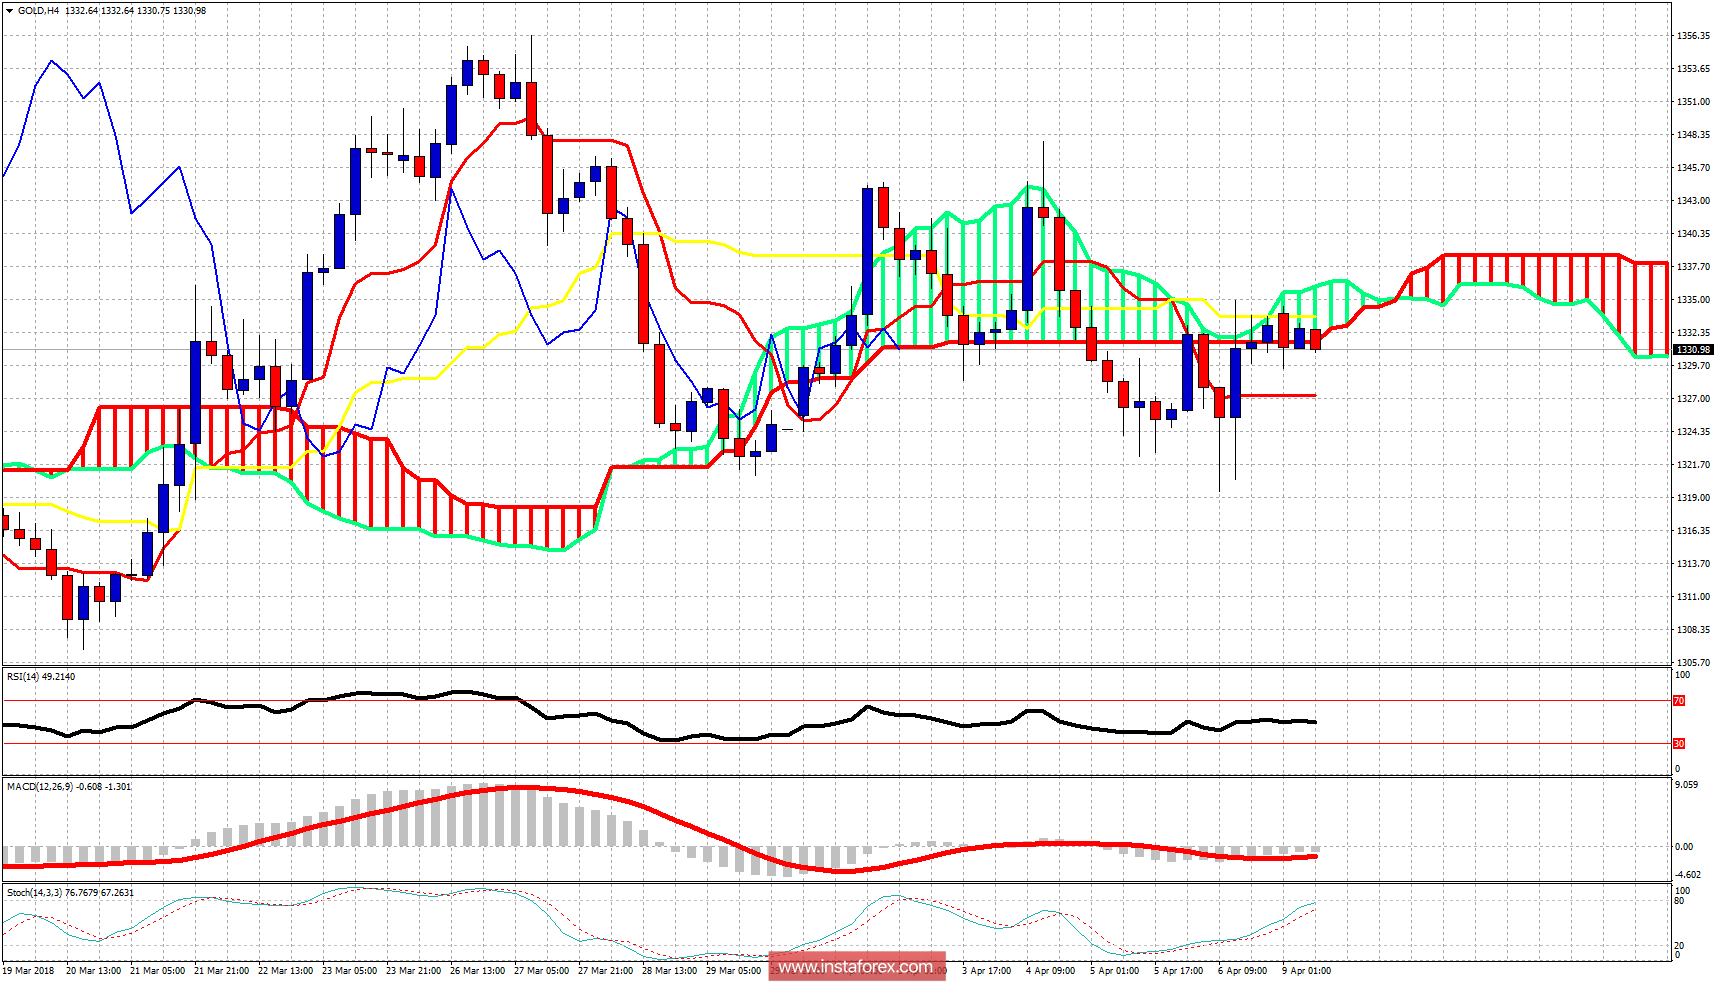
Red line - resistance
Blue line - support
On a weekly basis, the multiple rejection at the red trend line resistance is not a good long-term sign for gold bulls. Bulls must soon break above $1,355 for a move towards $1,400-$1,450 or they will be in danger for a deeper pull back towards $1,300-$1,260. Weekly support remains at $1,300. Until then we consider Gold price trading inside the multiweek trading range.