 English
  Русский
 Bahasa Indonesia
 Bahasa Malay
 ไทย
ไทย Español
 Deutsch
 Български
 Français
 Tiếng Việt
 中文
中文 বাংলা
বাংলা हिन्दी
 Čeština
 Українська
 Română

The Dollar index has broken above the trend line resistance and is now back testing it. Price remains above the 4 hour Ichimoku cloud and this is a bullish sign. If the price breaks back below the broken resistance trend line and below the cloud, we will have a false break out and change in short-term trend back to bearish, putting the 89-88.30 support area in danger.
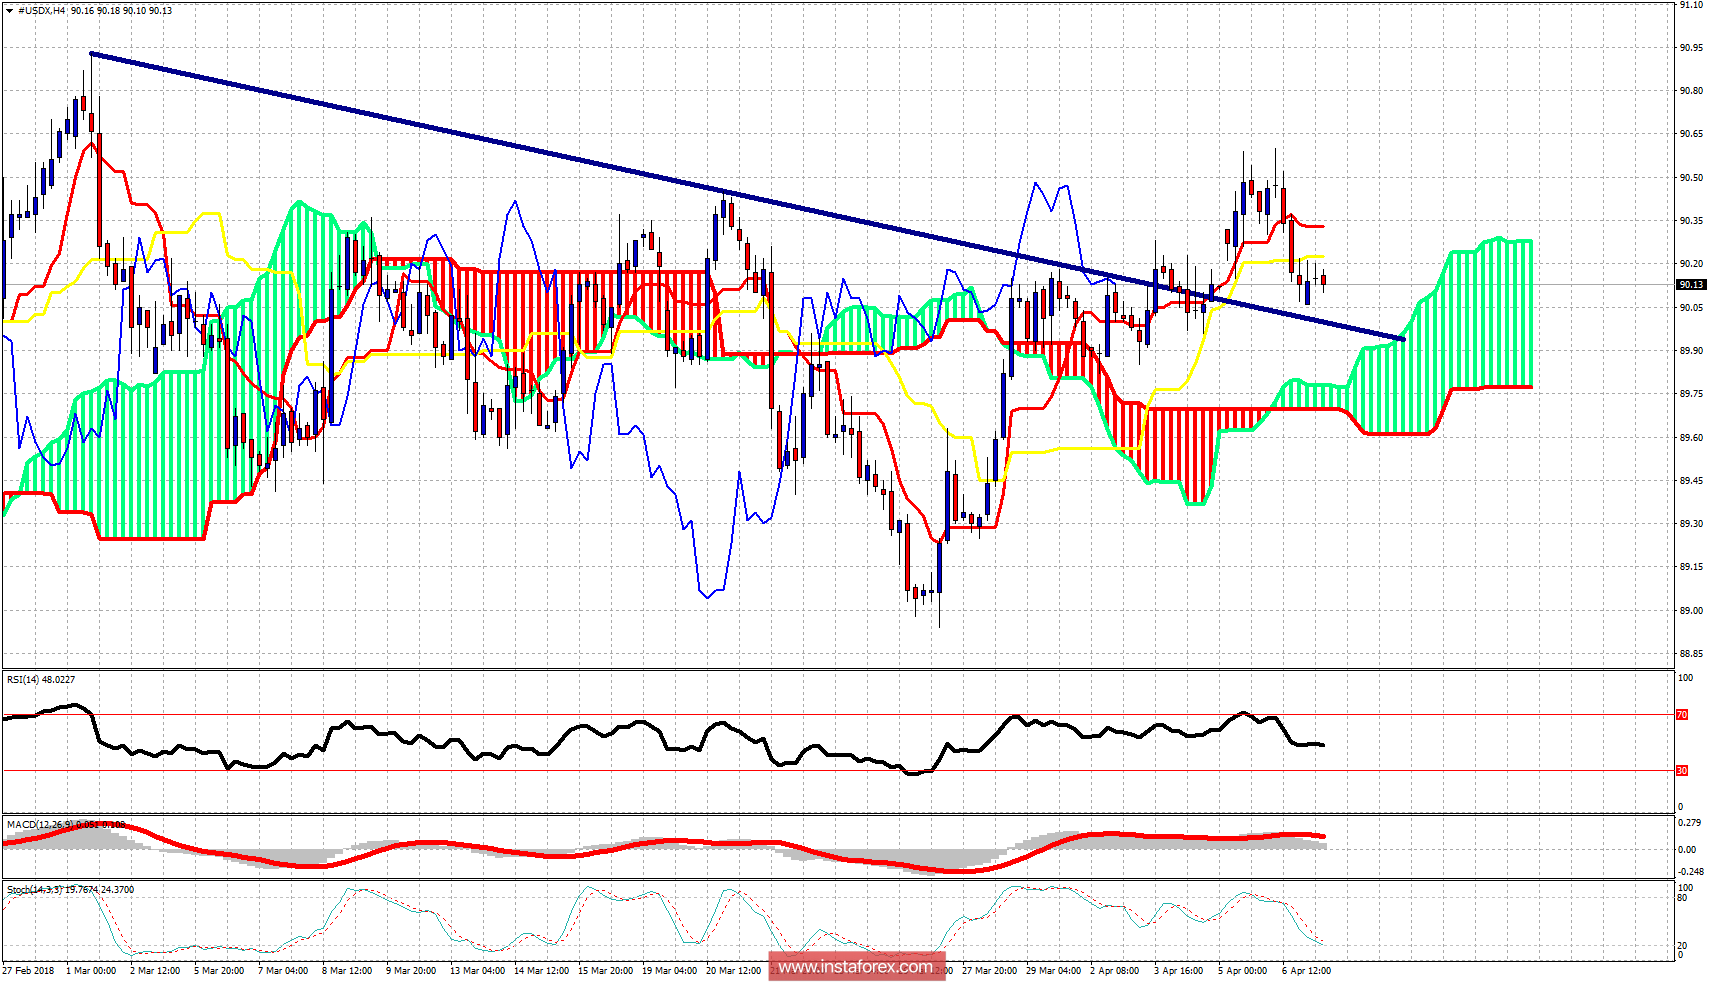
On a weekly basis, the price action shows us that buyers keep supporting the Dollar in any pull back towards 90. The price remains above the weekly tankan-sen. As long as we are above it we have chances of challenging the weekly kijun-sen (yellow line indicator) at 91.70.