 English
  Русский
 Bahasa Indonesia
 Bahasa Malay
 ไทย
ไทย Español
 Deutsch
 Български
 Français
 Tiếng Việt
 中文
中文 বাংলা
বাংলা हिन्दी
 Čeština
 Українська
 Română

Gold price continues to trade sideways below the short-term resistance of $1,350. Support at $1,338-40 is very important for the short term. I'm expecting another leg down towards $1,300 as the most probable scenario. Only a break above $1,365 will cancel this view and automatically make me bullish looking for a move towards $1,400-$1,430.
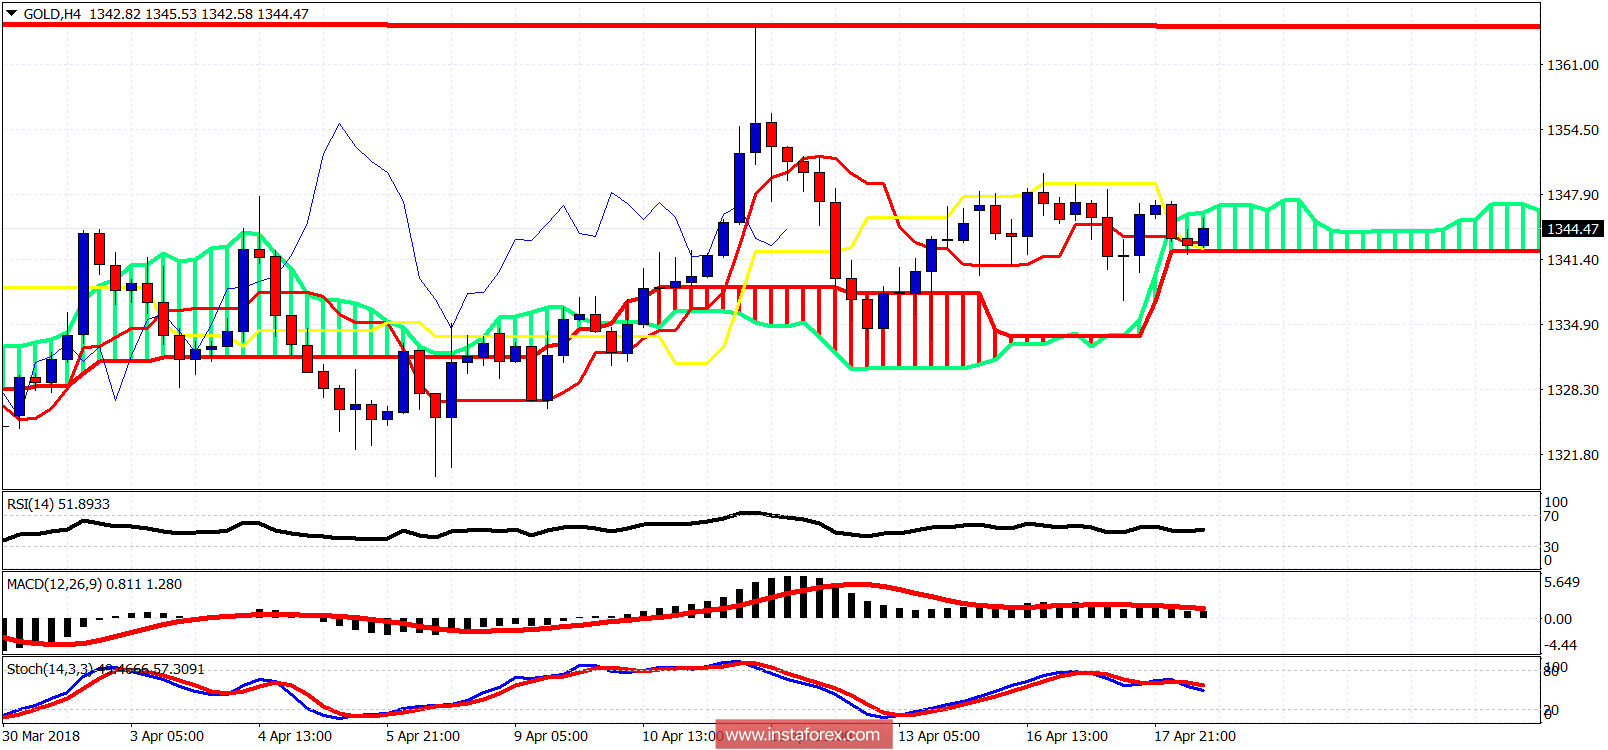
Red line -long-term resistance
Gold price is trading inside the Kumo (cloud). Price is now at support. Any move below $1,340 will be a sign of weakness. A daily close below $1,338 will be a sign of further weakness to come and probably $1,300. Bulls should first break above $1,350 resistance which is the recent highs. After that, they will need to make new 2018 highs and cancel the false break out of last week.