 English
  Русский
 Bahasa Indonesia
 Bahasa Malay
 ไทย
ไทย Español
 Deutsch
 Български
 Français
 Tiếng Việt
 中文
中文 বাংলা
বাংলা हिन्दी
 Čeština
 Українська
 Română

The pair plummeted during Wednesday's session and tested the 200 SMA at H1 chart, where a dynamic support is being found. Around that area, we can expect a demand concentration in order to push it higher towards the resistance level of 1.4386 once it manages to break above 1.4283. MACD indicator remains in the negative territory, favoring to the bears.
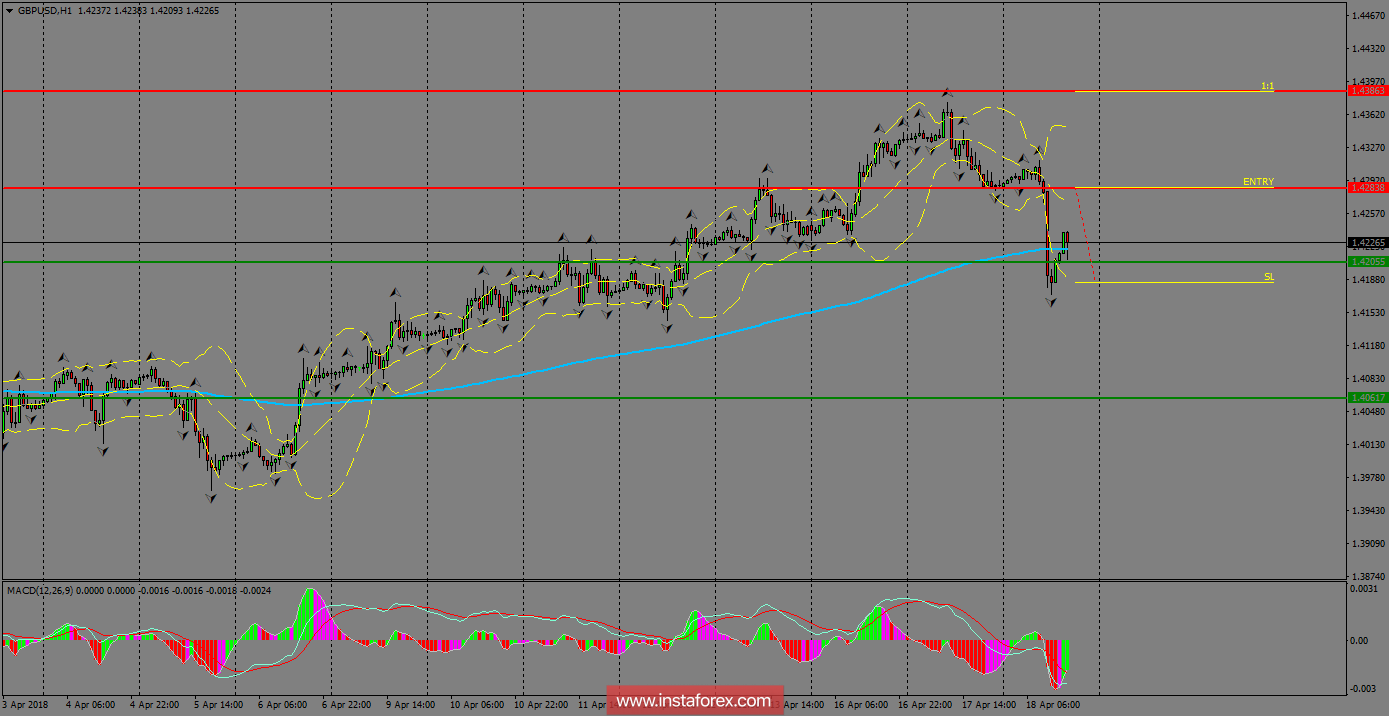
H1 chart's resistance levels: 1.4283 / 1.4386
H1 chart's support levels: 1.4205 / 1.4061
Trading recommendations for today: Based on the H1 chart, buy (long) orders only if the GBP/USD pair breaks a bullish candlestick; the resistance level is at 1.4283, take profit is at 1.4386 and stop loss is at 1.4183.