 English
  Русский
 Bahasa Indonesia
 Bahasa Malay
 ไทย
ไทย Español
 Deutsch
 Български
 Français
 Tiếng Việt
 中文
中文 বাংলা
বাংলা हिन्दी
 Čeština
 Українська
 Română

The pair has plummeted strong during last week and the bearish tone was the main topic in the price action across the board. At H1 chart, we're seeing a consolidation below the 200 SMA, while the Cable is finding support around 1.4205. If such level gives up in favors of the bears, then the next target would be the 1.4061 zone.
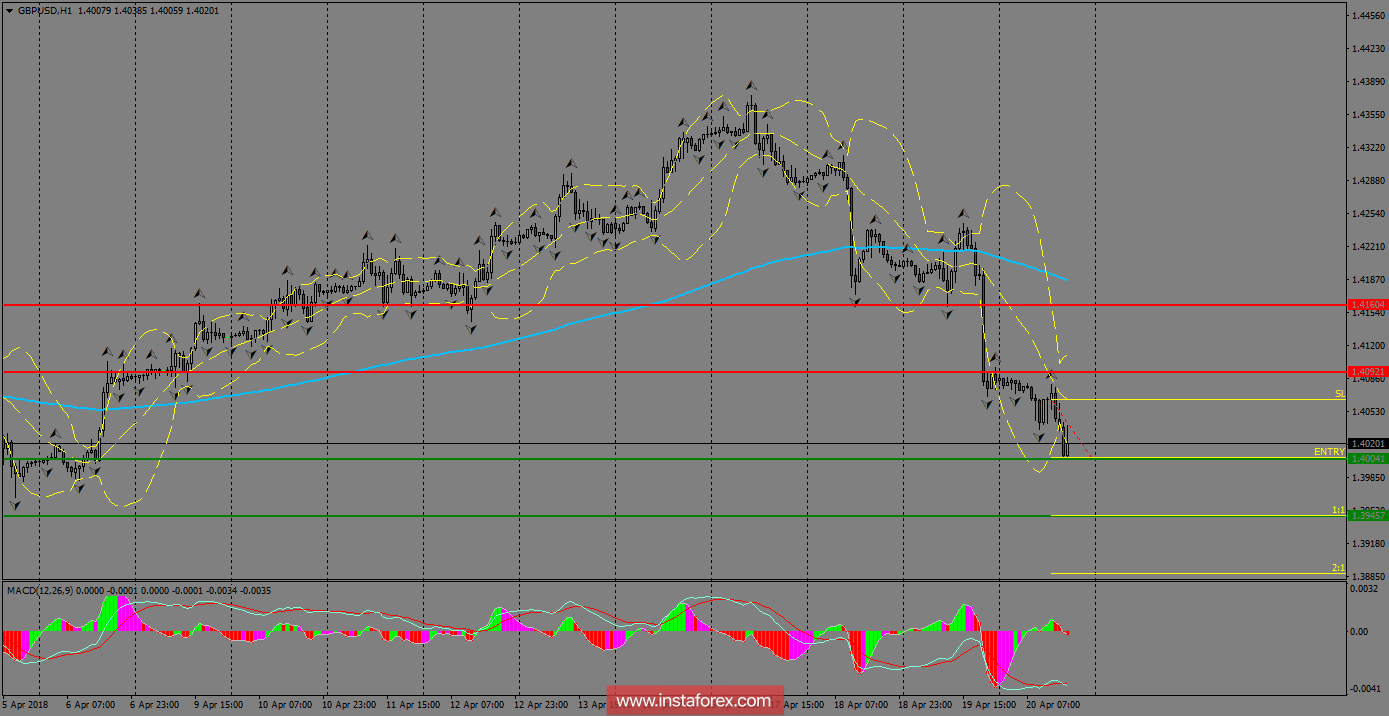
H1 chart's resistance levels: 1.4283 / 1.4386
H1 chart's support levels: 1.4205 / 1.4061
Trading recommendations for today: Based on the H1 chart, sell (short) orders only if the GBP/USD pair breaks a bullish candlestick; the resistance level is at 1.4004, take profit is at 1.3945 and stop loss is at 1.4064.