 English
  Русский
 Bahasa Indonesia
 Bahasa Malay
 ไทย
ไทย Español
 Deutsch
 Български
 Français
 Tiếng Việt
 中文
中文 বাংলা
বাংলা हिन्दी
 Čeština
 Українська
 Română

The pair is recovering from Tuesday's lows across the board, as the resistance level of 1.4205 is getting closer. If a breakout happens over there, then a corrective move should take place towards the 200 SMA at H1 chart, where we could expect a pullback. If that happens, GBP/USD will consolidate below the 1.4000 handle.
H1 chart's resistance levels: 1.4283 / 1.4386
H1 chart's support levels: 1.4205 / 1.4061
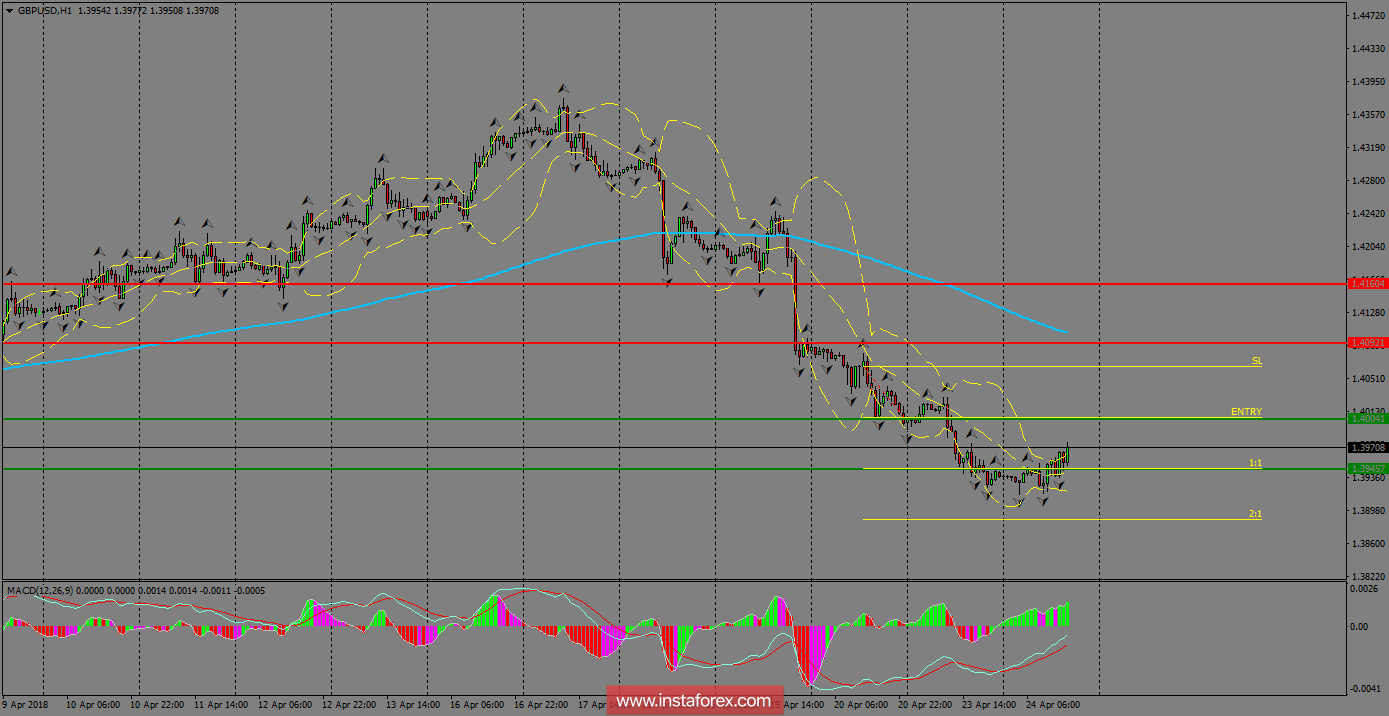
Trading recommendations for today: Based on the H1 chart, sell (short) orders only if the GBP/USD pair breaks a bullish candlestick; the resistance level is at 1.4004, take profit is at 1.3945 and stop loss is at 1.4064.