 English
  Русский
 Bahasa Indonesia
 Bahasa Malay
 ไทย
ไทย Español
 Deutsch
 Български
 Français
 Tiếng Việt
 中文
中文 বাংলা
বাংলা हिन्दी
 Čeština
 Українська
 Română

The index is forming a higher high pattern above the 90.63 level, which is now acting as a support. The focus is now placed on the 91.75 level, where the bulls could gather momentum in order to extend the bias for the short-term. However, a breakout below 90.63 should expose the 200 SMA at H1 chart. MACD indicator is favoring the bearish bias, as it stays in the negative territory.
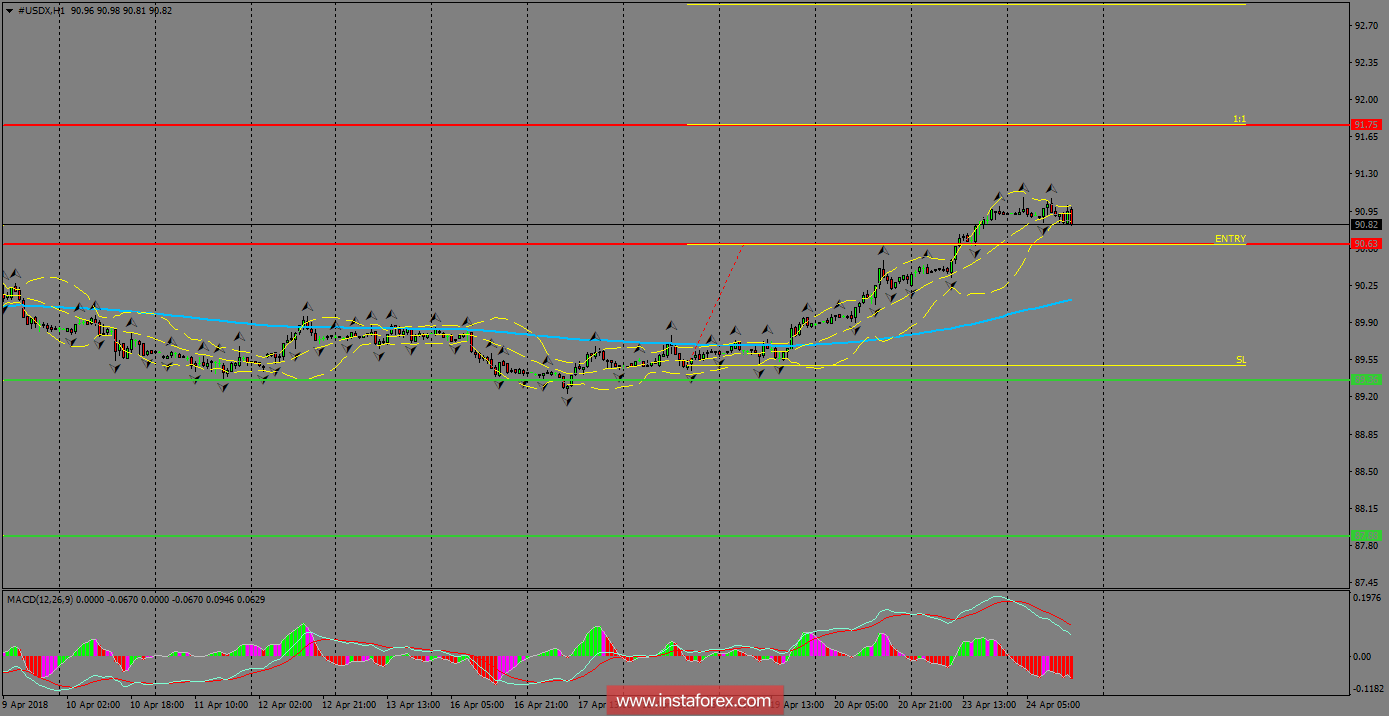
H1 chart's resistance levels: 90.63 / 91.75
H1 chart's support levels: 89.36 / 87.88
Trading recommendations for today: Based on the H1 chart, place buy (long) orders only if the USD Index breaks with a bearish candlestick; the support level is at 90.63, take profit is at 91.75 and stop loss is at 89.49.