 English
  Русский
 Bahasa Indonesia
 Bahasa Malay
 ไทย
ไทย Español
 Deutsch
 Български
 Français
 Tiếng Việt
 中文
中文 বাংলা
বাংলা हिन्दी
 Čeština
 Українська
 Română

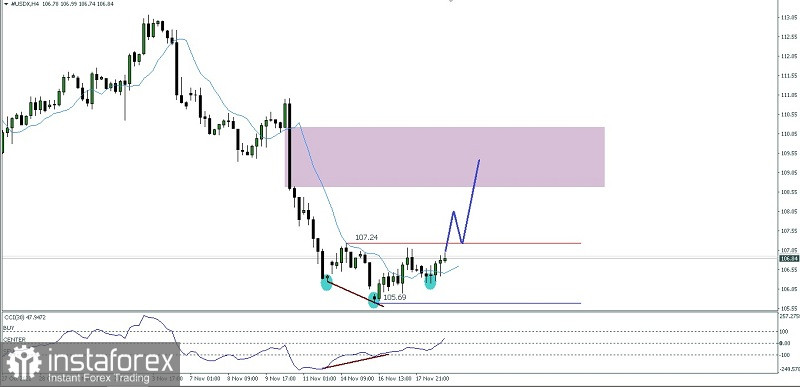
There are 2 interesting thing if we look at the 4 hour chart of the USD index:
1. There is a deviation between price movement with CCI indicator.
2. The appearance of Bullish Reversal Inverted Head And Shoulders pattern.
According to both of the fact belowin the near future it seems that #USDX will appreciate rallying upwards to break above the level of 107.24. If this level is successfully passed then #USDX has the potential to reach the level of the Fair value Gap area of 108.69-110.22 with the Mean Threshold at the level of 109.45 but if it is on its way to the target -The target level mentioned above suddenly reverses back down to pass the level of 105.69 then it is very likely that the bull setup that has been described above will cancel itself.
(Disclaimer)